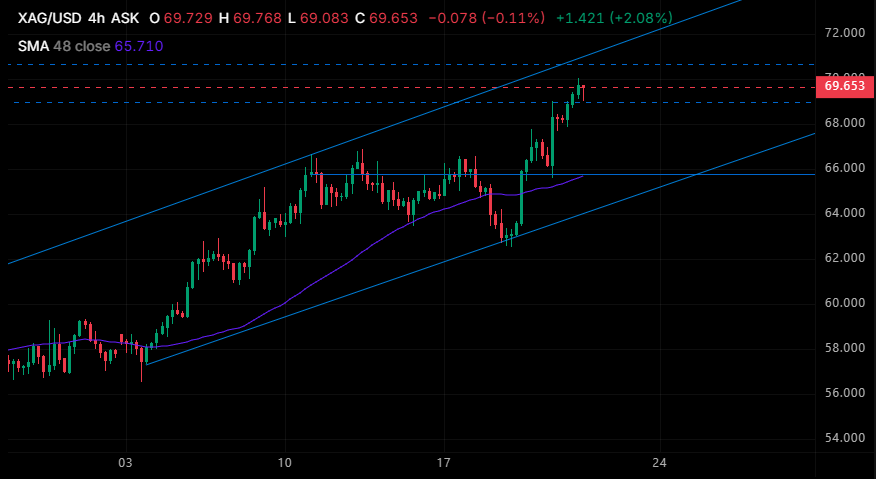
Note: This section contains information in English only.The 4-hour chart for XAG/USD reflects a strong bullish trend trading within an ascending parallel channel, with the price currently testing critical resistance near the channel's upper boundary and the 70.00 psychological handle. Because the price at 69.65 is extended significantly above its rising 48-period Simple Moving Average at 65.71, it faces the risk of short-term exhaustion—a failure to break resistance could trigger a corrective pullback toward prior breakout support around 65.80–66.00, whereas a decisive breakout above 70.00 would confirm trend acceleration toward higher levels.
Fri, 21 Aug 2026 13:22:23 GMT
Source: Dukascopy Bank SA