Note: This section contains information in English only.
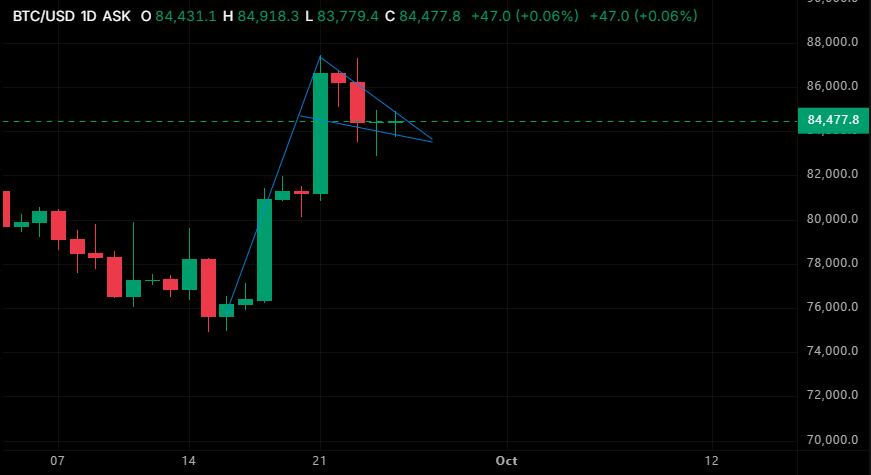
The daily BTC/USD chart displays a classic bullish pennant (or high-tight bull flag) consolidation pattern, forming after a steep, high-momentum advance (the flagpole) from the $76,000 swing lows up to near $87,000. Following that sharp impulse, price action is compressing between converging trendlines near the $84,477 level, characterized by lower highs and shallower lows as volatility contracts. In technical analysis, this structure represents a healthy pause and absorption of selling pressure, with a decisive breakout above the upper descending boundary typically signaling a continuation of the prior uptrend toward a measured move target near the $90,000–$92,000 zone.
Fri, 25 Sep 2026 08:32:34 GMT
Source: Dukascopy Bank SA
Actual Topics
Um mehr über die Forex/CFD Handelsplattform von Dukascopy Bank SA, sowie über den SWFX und weitere handelsbezogene Informationen zu erfahren,
rufen Sie uns bitte an oder hinterlassen Sie eine Rückrufanfrage.
rufen Sie uns bitte an oder hinterlassen Sie eine Rückrufanfrage.
Für weitere Informationen über eine mögliche Zusammenarbeit,
bitte rufen Sie uns an oder fordern Sie einen Rückruf an.
bitte rufen Sie uns an oder fordern Sie einen Rückruf an.
Um mehr über die Dukascopy Bank Binären Optionen zu lernen
/Forex Handelsplattform, SWFX und andere Handelsbezogenen Informationen,
bitte rufen Sie uns an oder fordern Sie einen Rückruf an.
bitte rufen Sie uns an oder fordern Sie einen Rückruf an.
Um mehr über die Forex/CFD Handelsplattform von Dukascopy Bank SA, sowie über den SWFX und weitere Handelsbezogenen Informationen zu erfahren,
rufen Sie uns bitte an oder hinterlassen Sie eine Rückrufanfrage.
rufen Sie uns bitte an oder hinterlassen Sie eine Rückrufanfrage.
Um mehr über Krypto Handel/CFD/ Forex Handelsplattform, SWFX und andere Handelsbezogenen Informationen zu erfahren,
bitte rufen Sie uns an oder fordern Sie einen Rückruf an.
bitte rufen Sie uns an oder fordern Sie einen Rückruf an.
Um mehr über Business Introducer und andere Handelsbezogenen Informationen zu erfahren,
bitte rufen Sie uns an oder fordern Sie einen Rückruf an.
bitte rufen Sie uns an oder fordern Sie einen Rückruf an.
Für weitere Informationen über eine mögliche Zusammenarbeit,
rufen Sie uns bitte an oder bitten Sie um einen Rückruf.
rufen Sie uns bitte an oder bitten Sie um einen Rückruf.