Note: This section contains information in English only.
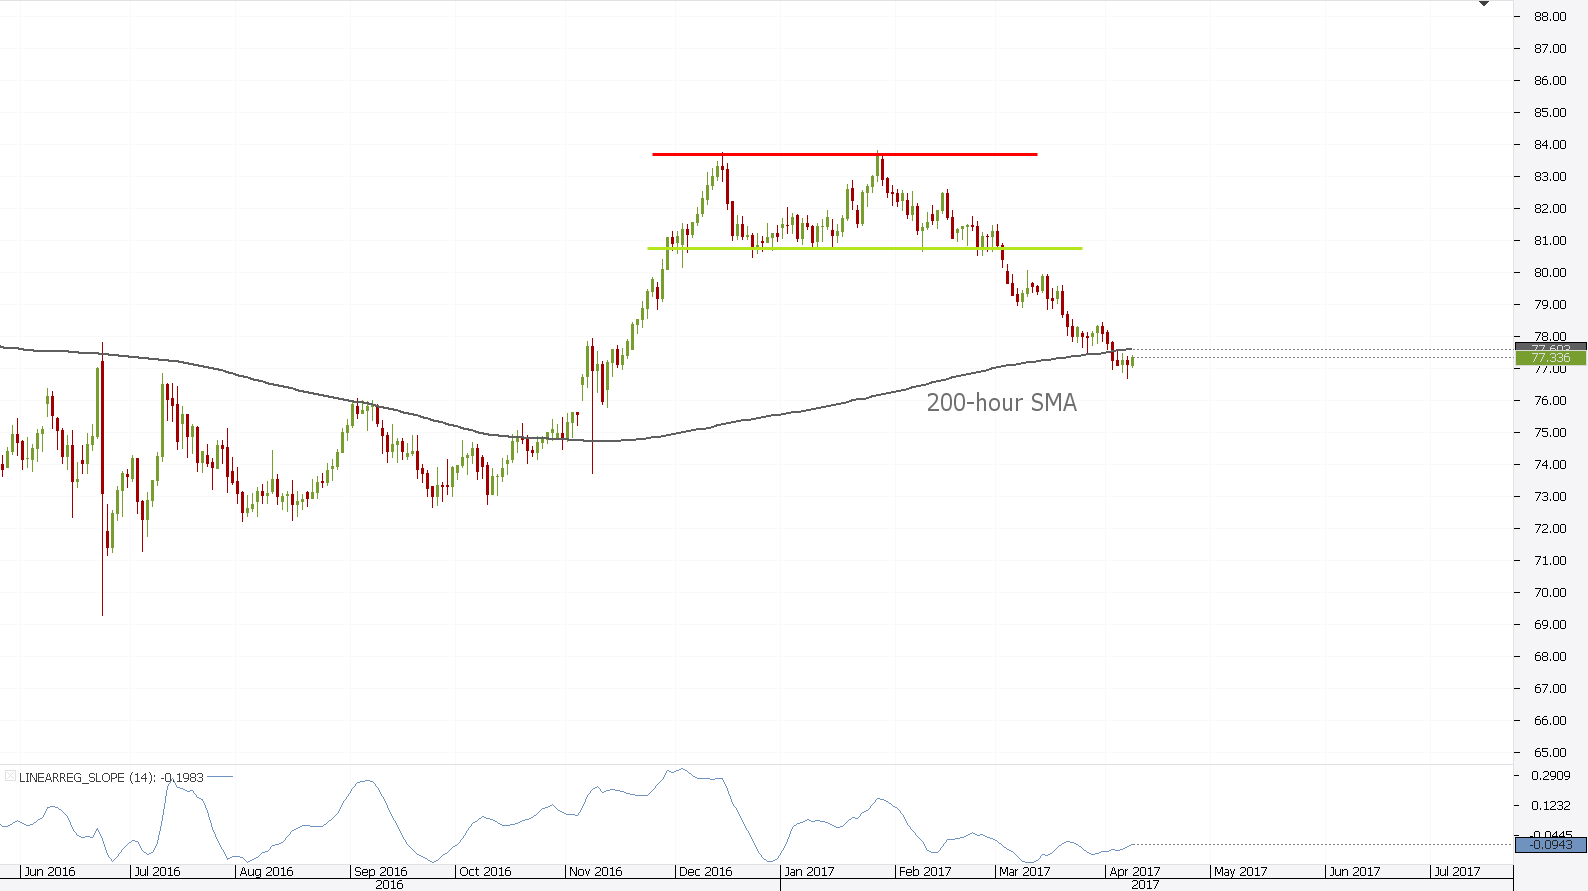
 There is almost no hope in sight for NZD/JPY with a double top on the daily chart and a strong downtrend flowing out of it. In addition, the pair has just under-stepped the 100-hour SMA and lies exactly below the extremely bearish crossover of the 55 and 100-hour SMAs, sending strong SELL signals to traders potentially leading to an even steeper down-fall from this moment. Immediate support rests just below at 76.55 and represents a cluster of the bottom Bollinger Band, the monthly S1 and the weekly S1. Upside potential is capped at 77.60, the 200-hour SMA.

Mon, 10 Apr 2017 10:10:35 GMT
Source: Dukascopy Bank SA
© Dukascopy Bank SA
© Dukascopy Bank SA
Actual Topics
Subscribe to "Fundamental Analysis" feed
Abonnieren
Um mehr über die Forex/CFD Handelsplattform von Dukascopy Bank SA, sowie über den SWFX und weitere handelsbezogene Informationen zu erfahren,
rufen Sie uns bitte an oder hinterlassen Sie eine Rückrufanfrage.
rufen Sie uns bitte an oder hinterlassen Sie eine Rückrufanfrage.
Für weitere Informationen über eine mögliche Zusammenarbeit,
bitte rufen Sie uns an oder fordern Sie einen Rückruf an.
bitte rufen Sie uns an oder fordern Sie einen Rückruf an.
Um mehr über die Dukascopy Bank Binären Optionen zu lernen
/Forex Handelsplattform, SWFX und andere Handelsbezogenen Informationen,
bitte rufen Sie uns an oder fordern Sie einen Rückruf an.
bitte rufen Sie uns an oder fordern Sie einen Rückruf an.
Um mehr über die Forex/CFD Handelsplattform von Dukascopy Bank SA, sowie über den SWFX und weitere Handelsbezogenen Informationen zu erfahren,
rufen Sie uns bitte an oder hinterlassen Sie eine Rückrufanfrage.
rufen Sie uns bitte an oder hinterlassen Sie eine Rückrufanfrage.
Um mehr über Krypto Handel/CFD/ Forex Handelsplattform, SWFX und andere Handelsbezogenen Informationen zu erfahren,
bitte rufen Sie uns an oder fordern Sie einen Rückruf an.
bitte rufen Sie uns an oder fordern Sie einen Rückruf an.
Um mehr über Business Introducer und andere Handelsbezogenen Informationen zu erfahren,
bitte rufen Sie uns an oder fordern Sie einen Rückruf an.
bitte rufen Sie uns an oder fordern Sie einen Rückruf an.
Für weitere Informationen über eine mögliche Zusammenarbeit,
rufen Sie uns bitte an oder bitten Sie um einen Rückruf.
rufen Sie uns bitte an oder bitten Sie um einen Rückruf.