Note: This section contains information in English only.
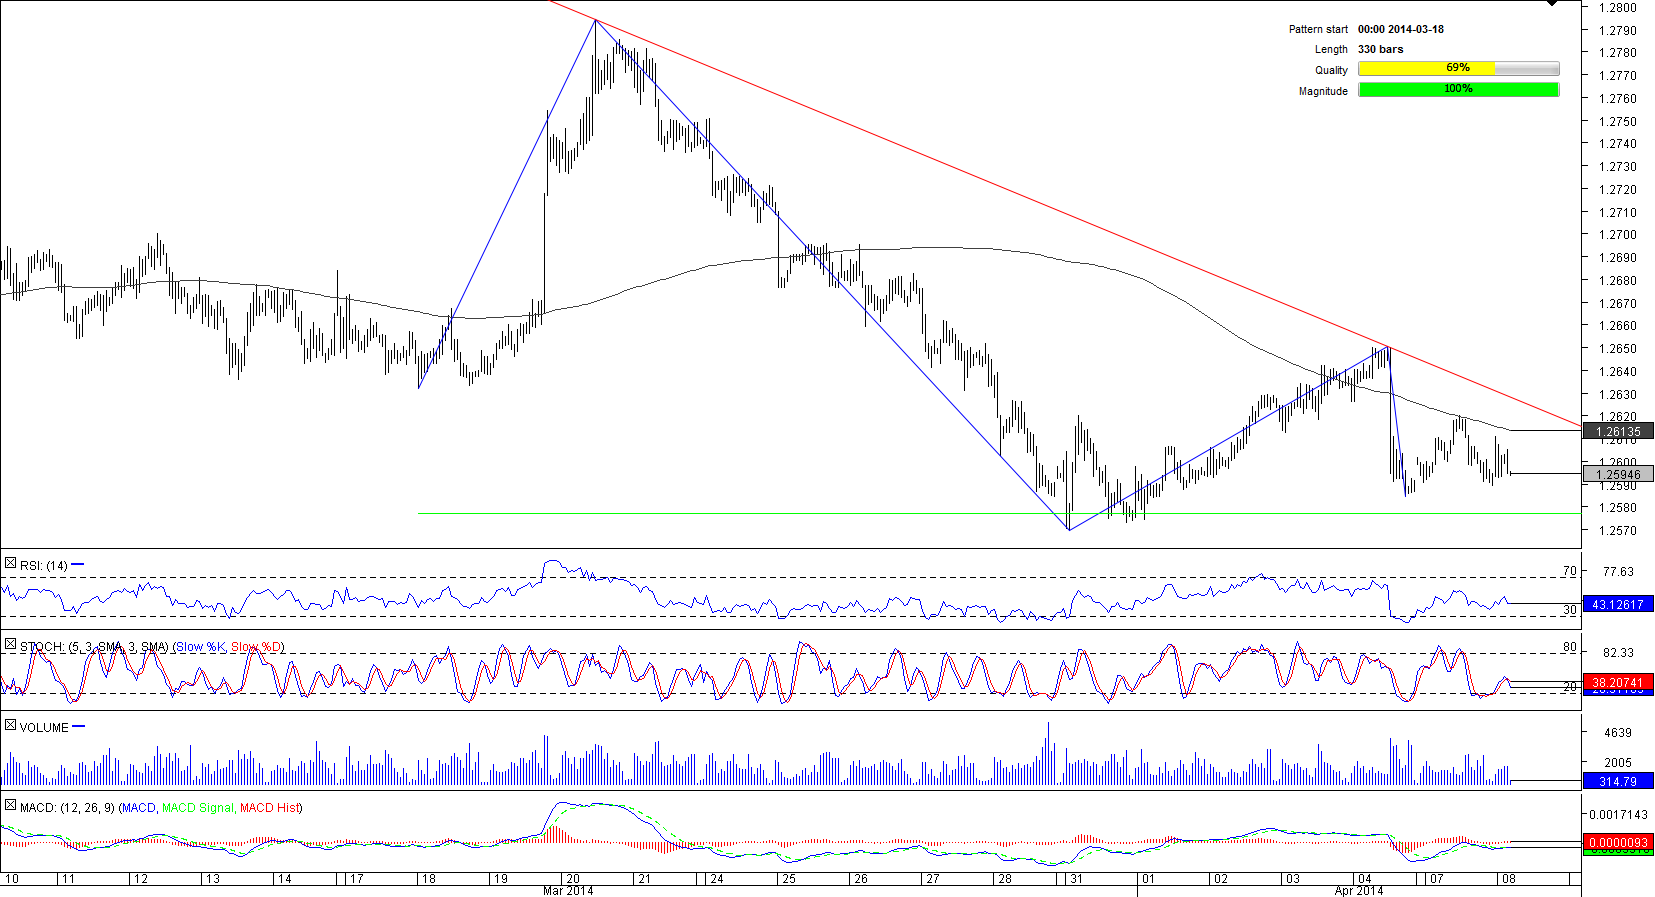
 USD/SGD shaped a 330-bar long descending triangle pattern on the one-hour chart. While trading within the bearish formation, the pair faced noticeable losses, erasing more than 200 pips during the last two weeks of March. Now the instrument is sitting not far away from the pattern's support at 1.2577; however, the breakout now seems unlikely as more than 80% of all orders at the SWFX are placed to buy the pair. Moreover, the pair is trading at some distance from the apex, which will be reached on April 14. At the same time, technical data indicates that bears are likely to dominate the market in both short and long terms.

Tue, 08 Apr 2014 06:44:14 GMT
Source: Dukascopy Bank SA
© Dukascopy Bank SA
© Dukascopy Bank SA
Actual Topics
Subscribe to "Fundamental Analysis" feed
Abonnieren
Um mehr über die Forex/CFD Handelsplattform von Dukascopy Bank SA, sowie über den SWFX und weitere handelsbezogene Informationen zu erfahren,
rufen Sie uns bitte an oder hinterlassen Sie eine Rückrufanfrage.
rufen Sie uns bitte an oder hinterlassen Sie eine Rückrufanfrage.
Für weitere Informationen über eine mögliche Zusammenarbeit,
bitte rufen Sie uns an oder fordern Sie einen Rückruf an.
bitte rufen Sie uns an oder fordern Sie einen Rückruf an.
Um mehr über die Dukascopy Bank Binären Optionen zu lernen
/Forex Handelsplattform, SWFX und andere Handelsbezogenen Informationen,
bitte rufen Sie uns an oder fordern Sie einen Rückruf an.
bitte rufen Sie uns an oder fordern Sie einen Rückruf an.
Um mehr über die Forex/CFD Handelsplattform von Dukascopy Bank SA, sowie über den SWFX und weitere Handelsbezogenen Informationen zu erfahren,
rufen Sie uns bitte an oder hinterlassen Sie eine Rückrufanfrage.
rufen Sie uns bitte an oder hinterlassen Sie eine Rückrufanfrage.
Um mehr über Krypto Handel/CFD/ Forex Handelsplattform, SWFX und andere Handelsbezogenen Informationen zu erfahren,
bitte rufen Sie uns an oder fordern Sie einen Rückruf an.
bitte rufen Sie uns an oder fordern Sie einen Rückruf an.
Um mehr über Business Introducer und andere Handelsbezogenen Informationen zu erfahren,
bitte rufen Sie uns an oder fordern Sie einen Rückruf an.
bitte rufen Sie uns an oder fordern Sie einen Rückruf an.
Für weitere Informationen über eine mögliche Zusammenarbeit,
rufen Sie uns bitte an oder bitten Sie um einen Rückruf.
rufen Sie uns bitte an oder bitten Sie um einen Rückruf.