At the moment, the instrument is trading within the area bounded by the triangle trend-lines and is not likely to exit the pattern in the hours to come given that the apex will be reached only in a week. At the same time, technical indicators are neutral for short and medium terms and point to a weakness in the long-term.
Note: This section contains information in English only.
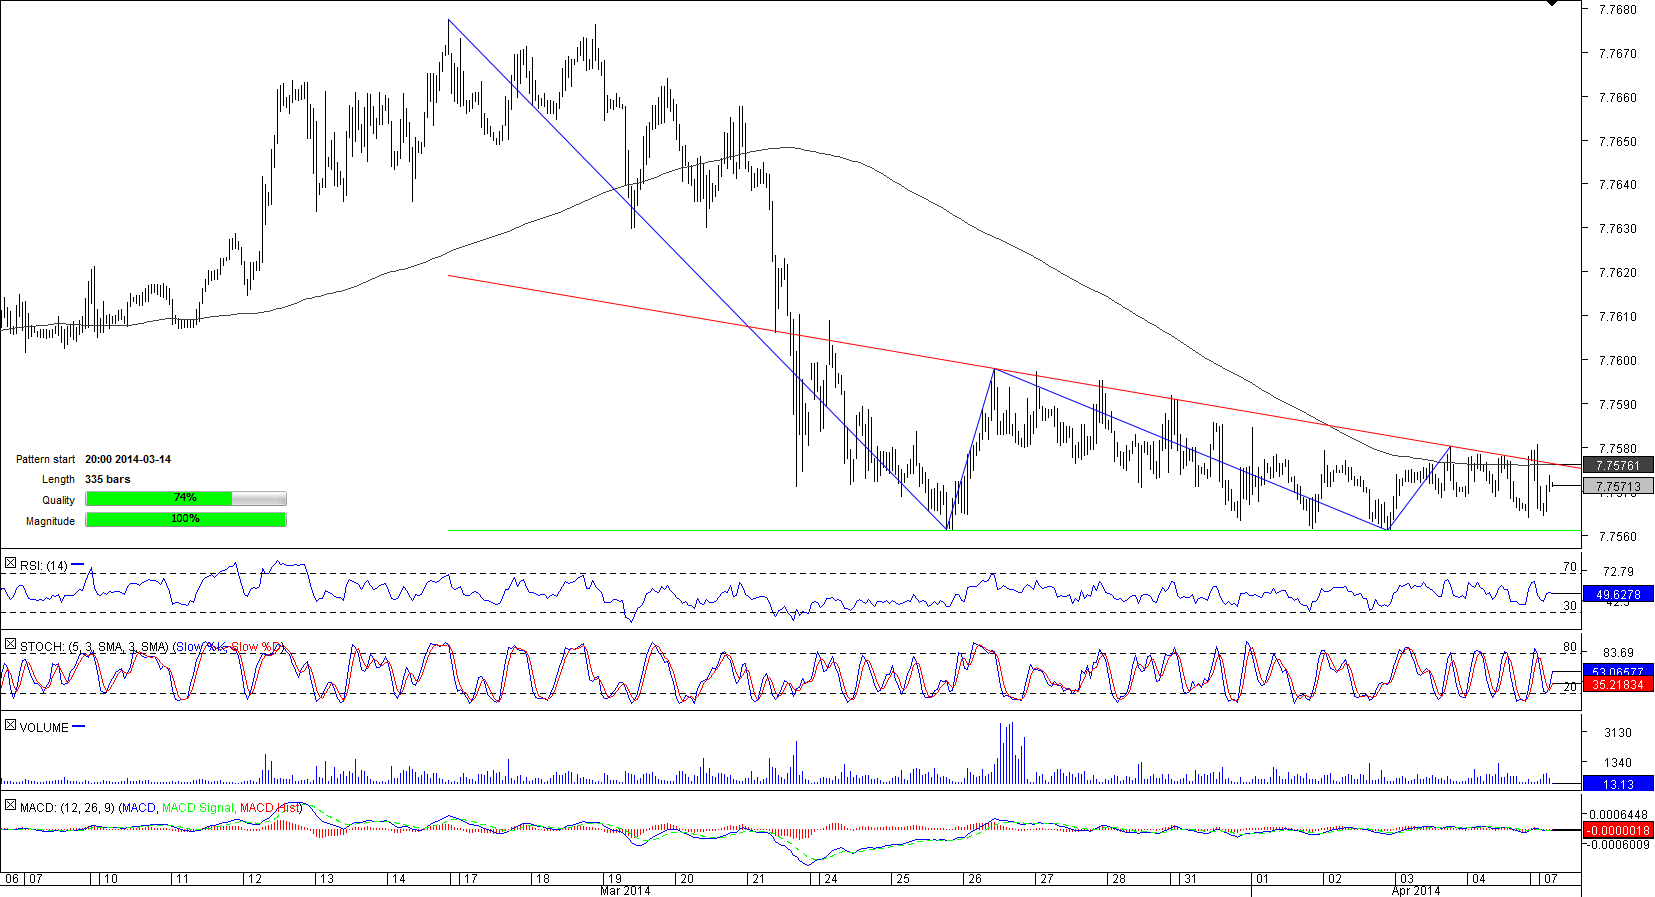
 A sharp decline performed by the U.S. Dollar against its Hong Kong peer started in mid-March when the currency couple reached a one-month high of 7.7676. This peak also was a starting point of the 335-bar long descending triangle pattern that sent the pair to a one-month low of 7.7561.
At the moment, the instrument is trading within the area bounded by the triangle trend-lines and is not likely to exit the pattern in the hours to come given that the apex will be reached only in a week. At the same time, technical indicators are neutral for short and medium terms and point to a weakness in the long-term.

Mon, 07 Apr 2014 06:27:06 GMT
Source: Dukascopy Bank SA
© Dukascopy Bank SA
At the moment, the instrument is trading within the area bounded by the triangle trend-lines and is not likely to exit the pattern in the hours to come given that the apex will be reached only in a week. At the same time, technical indicators are neutral for short and medium terms and point to a weakness in the long-term.
© Dukascopy Bank SA
Actual Topics
Subscribe to "Fundamental Analysis" feed
Abonnieren
Um mehr über die Forex/CFD Handelsplattform von Dukascopy Bank SA, sowie über den SWFX und weitere handelsbezogene Informationen zu erfahren,
rufen Sie uns bitte an oder hinterlassen Sie eine Rückrufanfrage.
rufen Sie uns bitte an oder hinterlassen Sie eine Rückrufanfrage.
Für weitere Informationen über eine mögliche Zusammenarbeit,
bitte rufen Sie uns an oder fordern Sie einen Rückruf an.
bitte rufen Sie uns an oder fordern Sie einen Rückruf an.
Um mehr über die Dukascopy Bank Binären Optionen zu lernen
/Forex Handelsplattform, SWFX und andere Handelsbezogenen Informationen,
bitte rufen Sie uns an oder fordern Sie einen Rückruf an.
bitte rufen Sie uns an oder fordern Sie einen Rückruf an.
Um mehr über die Forex/CFD Handelsplattform von Dukascopy Bank SA, sowie über den SWFX und weitere Handelsbezogenen Informationen zu erfahren,
rufen Sie uns bitte an oder hinterlassen Sie eine Rückrufanfrage.
rufen Sie uns bitte an oder hinterlassen Sie eine Rückrufanfrage.
Um mehr über Krypto Handel/CFD/ Forex Handelsplattform, SWFX und andere Handelsbezogenen Informationen zu erfahren,
bitte rufen Sie uns an oder fordern Sie einen Rückruf an.
bitte rufen Sie uns an oder fordern Sie einen Rückruf an.
Um mehr über Business Introducer und andere Handelsbezogenen Informationen zu erfahren,
bitte rufen Sie uns an oder fordern Sie einen Rückruf an.
bitte rufen Sie uns an oder fordern Sie einen Rückruf an.
Für weitere Informationen über eine mögliche Zusammenarbeit,
rufen Sie uns bitte an oder bitten Sie um einen Rückruf.
rufen Sie uns bitte an oder bitten Sie um einen Rückruf.