Note: This section contains information in English only.
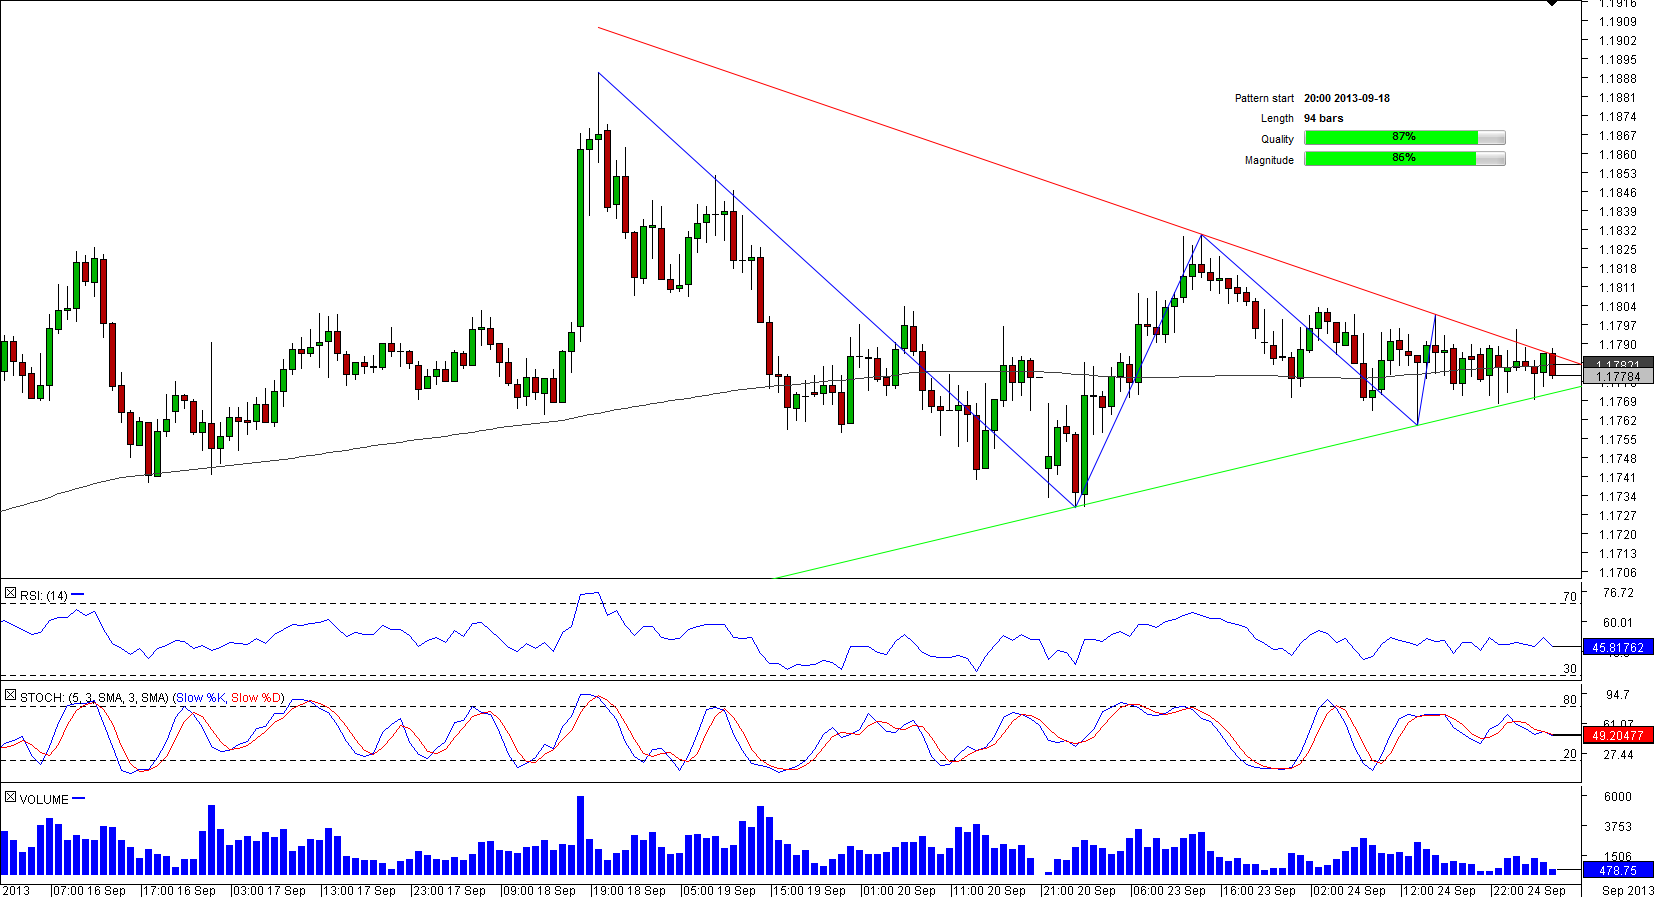
 During the past 100 bars the trading range of AUD/SGD has been generally contracting around the long-term moving average for 200 periods, resulting in the appearance of the symmetrical triangle on an hourly chart. Noteworthy is the fact that there is room only for a few bars to be formed until the apex of the pattern is reached, meaning the breakout may occur at any moment now.

Wed, 25 Sep 2013 07:26:50 GMT
Source: Dukascopy Bank SA
© Dukascopy Bank SA
Judging by the daily technical indicators, most of which are giving ‘buy' signals, the risks are skewed to the upside, but then the currency pair will have to overcome 1.1803 and 1.1824 on the way to the local high.
© Dukascopy Bank SA
Actual Topics
Subscribe to "Fundamental Analysis" feed
Abonnieren
Um mehr über die Forex/CFD Handelsplattform von Dukascopy Bank SA, sowie über den SWFX und weitere handelsbezogene Informationen zu erfahren,
rufen Sie uns bitte an oder hinterlassen Sie eine Rückrufanfrage.
rufen Sie uns bitte an oder hinterlassen Sie eine Rückrufanfrage.
Für weitere Informationen über eine mögliche Zusammenarbeit,
bitte rufen Sie uns an oder fordern Sie einen Rückruf an.
bitte rufen Sie uns an oder fordern Sie einen Rückruf an.
Um mehr über die Dukascopy Bank Binären Optionen zu lernen
/Forex Handelsplattform, SWFX und andere Handelsbezogenen Informationen,
bitte rufen Sie uns an oder fordern Sie einen Rückruf an.
bitte rufen Sie uns an oder fordern Sie einen Rückruf an.
Um mehr über die Forex/CFD Handelsplattform von Dukascopy Bank SA, sowie über den SWFX und weitere Handelsbezogenen Informationen zu erfahren,
rufen Sie uns bitte an oder hinterlassen Sie eine Rückrufanfrage.
rufen Sie uns bitte an oder hinterlassen Sie eine Rückrufanfrage.
Um mehr über Krypto Handel/CFD/ Forex Handelsplattform, SWFX und andere Handelsbezogenen Informationen zu erfahren,
bitte rufen Sie uns an oder fordern Sie einen Rückruf an.
bitte rufen Sie uns an oder fordern Sie einen Rückruf an.
Um mehr über Business Introducer und andere Handelsbezogenen Informationen zu erfahren,
bitte rufen Sie uns an oder fordern Sie einen Rückruf an.
bitte rufen Sie uns an oder fordern Sie einen Rückruf an.
Für weitere Informationen über eine mögliche Zusammenarbeit,
rufen Sie uns bitte an oder bitten Sie um einen Rückruf.
rufen Sie uns bitte an oder bitten Sie um einen Rückruf.