GBP/USD slid lower towards 1.3250 in the last weeks, moving towards October ranges.
Overall volatility may be persistent, however lower overall volatility may be considered a primary scenario, week 47 may see higher volatility as more relevant fundamental data will be presented from United Kingdom.
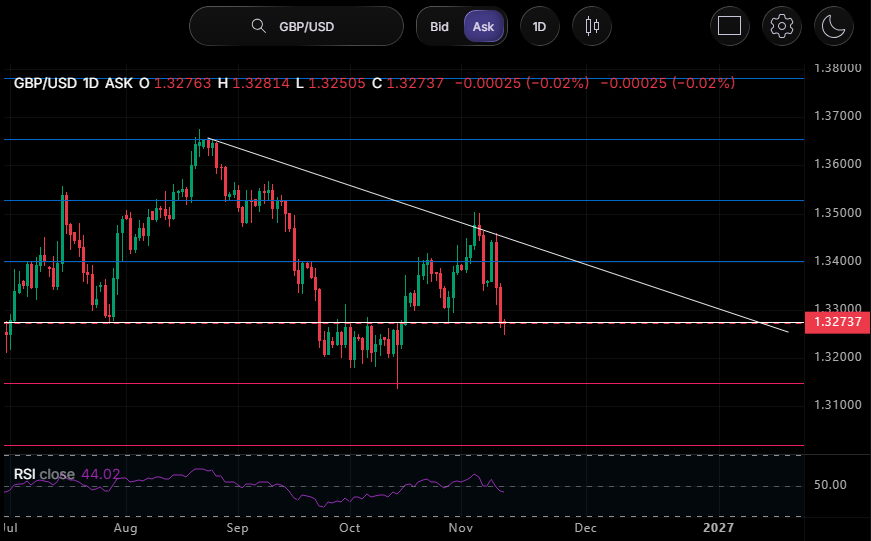
GBP/USD Daily Chart Analysis
GBP/USD on the daily timeframe is currently trading at 1.32737 within a dominant medium-term bearish structure after suffering a sharp rejection from a descending resistance trendline near 1.3500. Following consecutive large bearish candles that sliced back below the 1.3400 pivot, price is now testing immediate horizontal support at 1.3270–1.3275, while the RSI at 44.02 has rolled over from its neutral 50.00 midline with plenty of downside room remaining before reaching oversold territory. A decisive daily close below 1.3270 would expose the October consolidation floor around 1.3180–1.3200 and major horizontal support at 1.3150, whereas a successful defense of 1.3270 could spark a corrective bounce toward 1.3350–1.3400, though bulls must reclaim the descending trendline and 1.3500 swing high to invalidate the broader downtrend.
GBP/USD Daily Chart
GBP/USD Weekly Chart analysis
GBP/USD finished the week right on its central pivot after failing to hold an early rally and closing near its lows. Throughout the year, the pair has remained trapped between a sturdy triple-bottom floor at 1.3148 and heavy overhead resistance. Because a steady series of lower highs is pressing down against that flat support base—forming a descending triangle alongside weakening RSI momentum—the overall bias leans neutral to bearish.
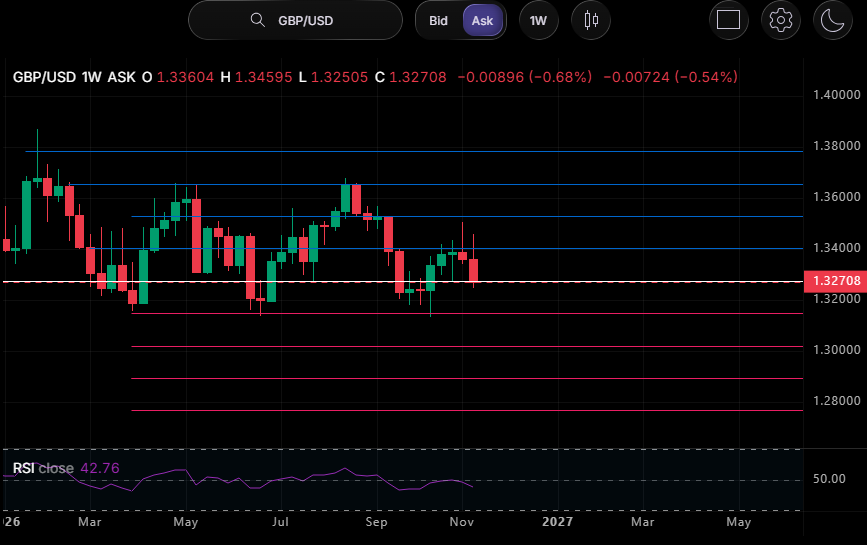
The most likely outcome for next week is continued range-bound trading between that floor and resistance at 1.3401, making short-term rallies attractive for selling. A decisive weekly close below the floor would confirm a breakdown and open the door to deeper losses toward 1.3020, while bulls need a weekly close above resistance to invalidate the bearish pattern and spark a recovery.