Note: This section contains information in English only.


Fri, 04 Mar 2016 14:39:14 GMT
Source: Dukascopy Bank SA
© Dukascopy Bank SA
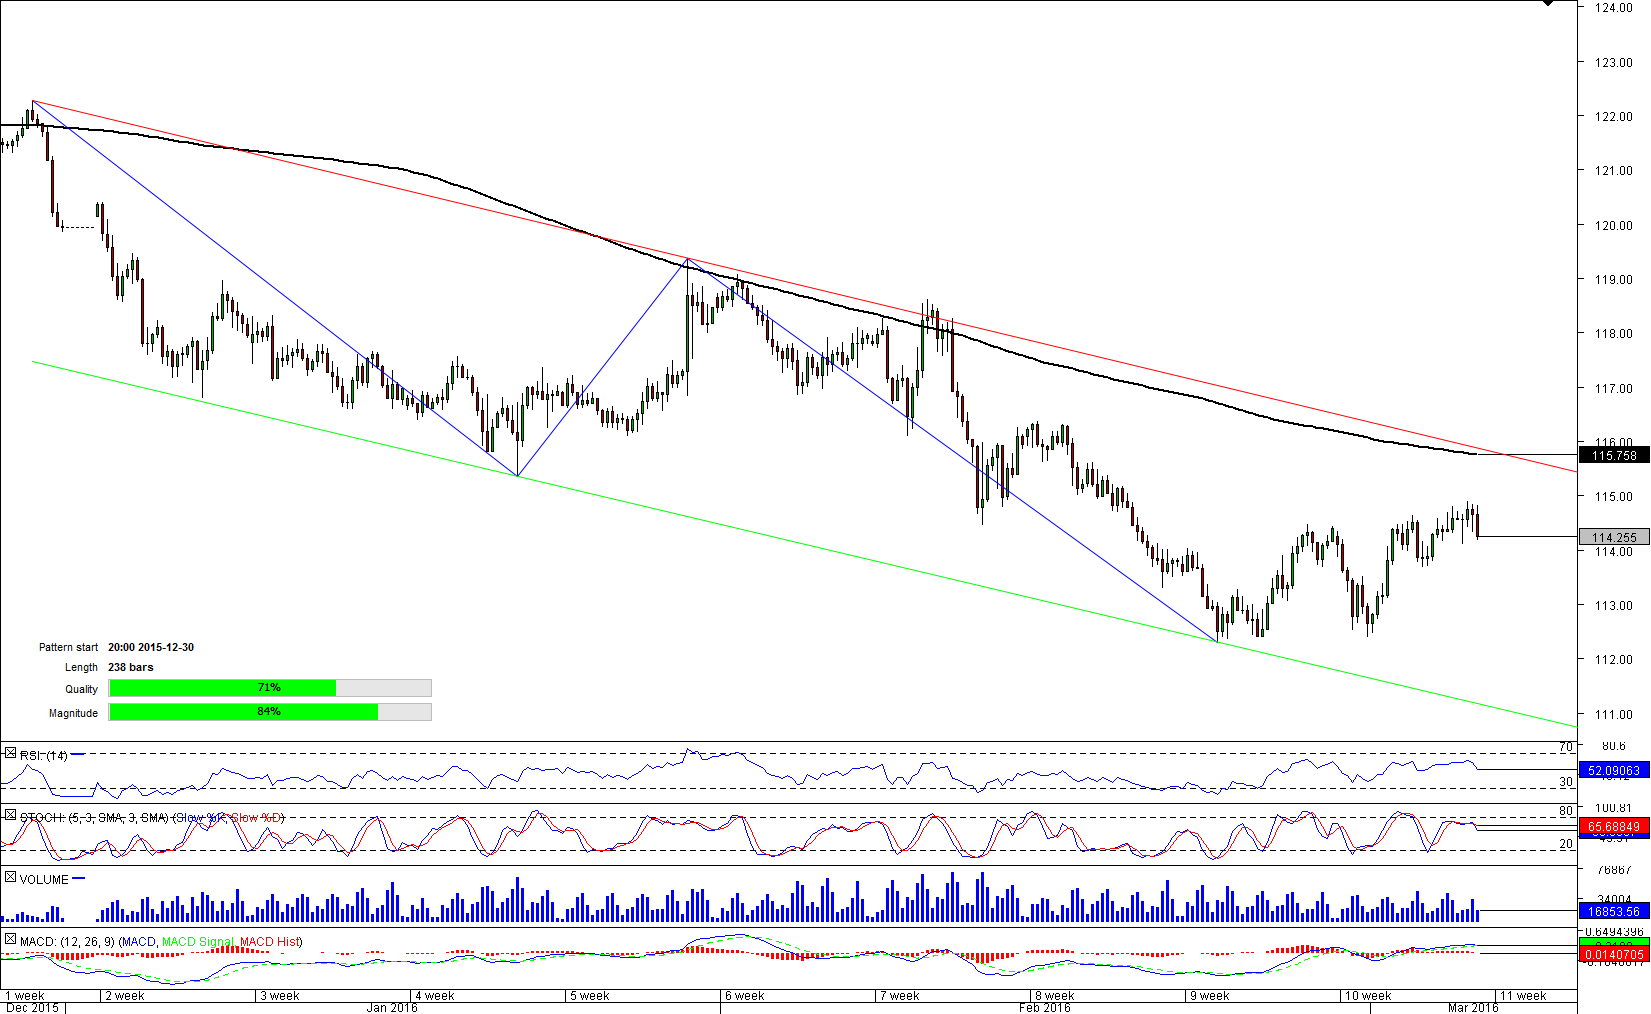
Even within the channel down pattern, the Swiss currency is going up at the moment. The pair is somewhat stuck around the monthly PP at 114.75, which is reinforced by the weekly R1 from above. By eliminating this resistance, CHF/JPY will pave the way for a rally up to the 200-period SMA at 115.79, followed by the weekly R2 and the upper boundary of the channel. From here we foresee another downward leg and a testing of the Feb low at 112.29 in the medium-term. The negative outlook is backed by daily technical indicators, while one-week studies are nearing the point of becoming, on aggregate, short as well. Moreover, the Franc is still overbought, as 72% of all trades are long.
© Dukascopy Bank SA
Actual Topics
Subscribe to "Fundamental Analysis" feed
Souscrire
To learn more about Dukascopy Bank CFD / Forex trading platform, SWFX and other trading related information,
please call us or make callback request.
please call us or make callback request.
For further information regarding potential cooperation,
please call us or make callback request.
please call us or make callback request.
To learn more about Dukascopy Bank Binary Options
/ Forex trading platform, SWFX and other trading related information,
please call us or make callback request.
please call us or make callback request.
To learn more about Dukascopy Bank CFD / Forex trading platform, SWFX and other trading related information,
please call us or make callback request.
please call us or make callback request.
To learn more about Crypto Trading / CFD / Forex trading platform, SWFX and other trading related information,
please call us or make callback request.
please call us or make callback request.
To learn more about Business Introducer and other trading related information,
please call us or make callback request.
please call us or make callback request.
For further information regarding potential cooperation,
please call us or make callback request.
please call us or make callback request.