Note: This section contains information in English only.
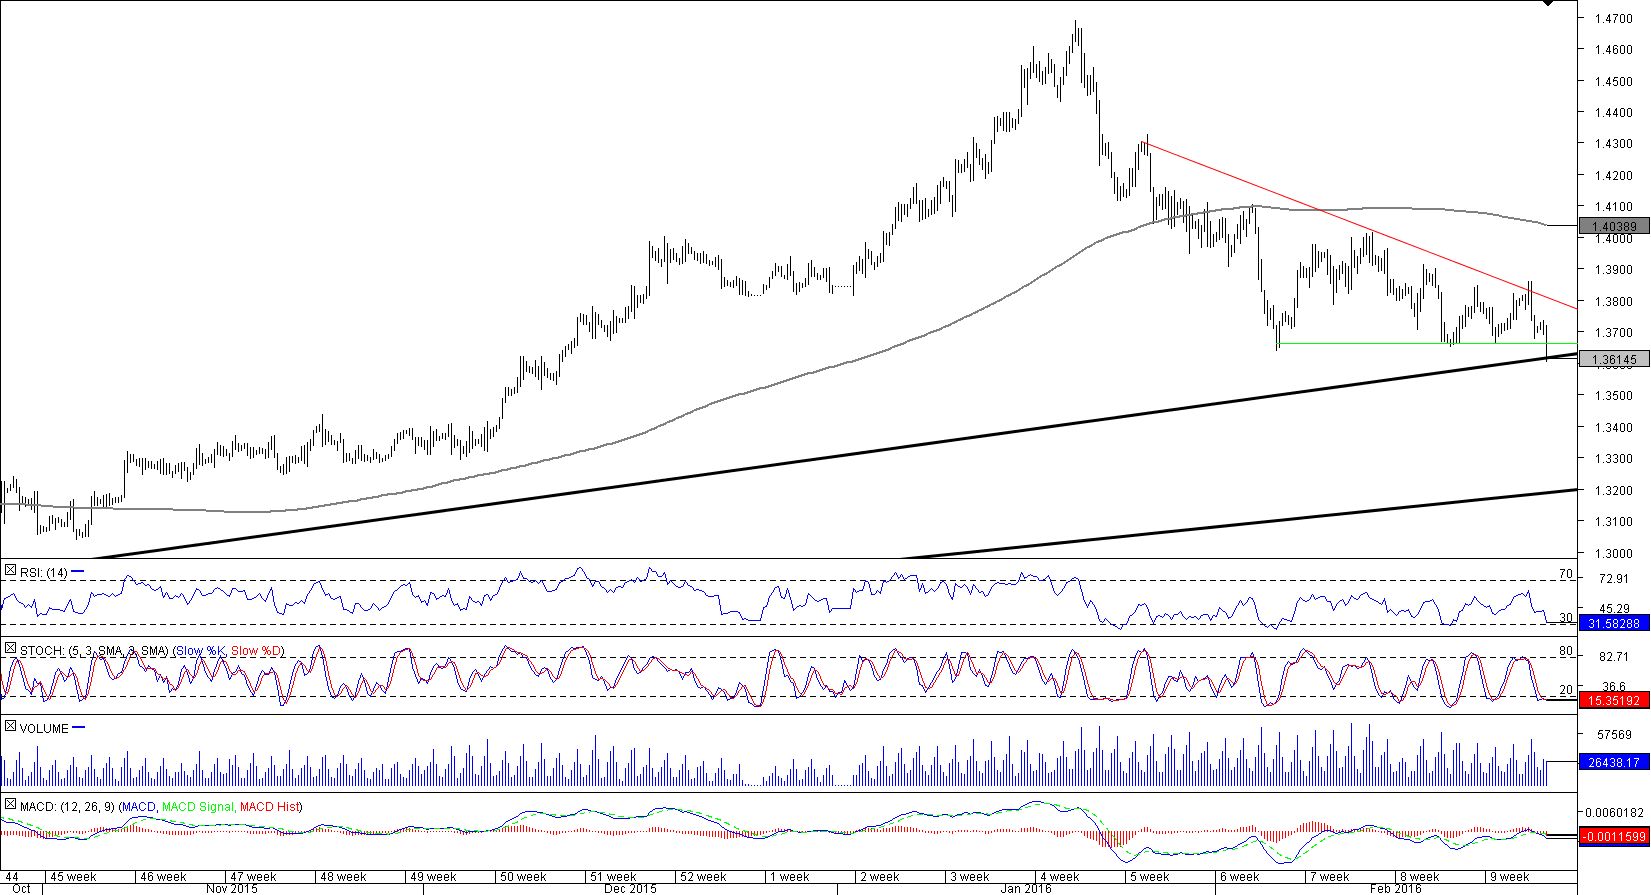
 Although USD/CAD has formed a descending triangle, which usually portends a decline, the risks are skewed to the upside. The reason to be bullish on the pair is the solid demand area at 1.3662/34, created by the most recent lows, monthly S1, and the 10-month up-trend. Accordingly, the price is likely to bounce back to the long-term moving average and February 11 high at 1.4040/16. The next target will be already 1.4690, namely the highest level since January. At the same time, if we see a close under 1.3662/34, this will not immediately invalidate the positive outlook. The bulls will have a good chance to recuperate at 1.32, where we have the 20-month up-trend.

Thu, 25 Feb 2016 14:22:06 GMT
Source: Dukascopy Bank SA
© Dukascopy Bank SA
© Dukascopy Bank SA
Actual Topics
Subscribe to "Fundamental Analysis" feed
Souscrire
To learn more about Dukascopy Bank CFD / Forex trading platform, SWFX and other trading related information,
please call us or make callback request.
please call us or make callback request.
For further information regarding potential cooperation,
please call us or make callback request.
please call us or make callback request.
To learn more about Dukascopy Bank Binary Options
/ Forex trading platform, SWFX and other trading related information,
please call us or make callback request.
please call us or make callback request.
To learn more about Dukascopy Bank CFD / Forex trading platform, SWFX and other trading related information,
please call us or make callback request.
please call us or make callback request.
To learn more about Crypto Trading / CFD / Forex trading platform, SWFX and other trading related information,
please call us or make callback request.
please call us or make callback request.
To learn more about Business Introducer and other trading related information,
please call us or make callback request.
please call us or make callback request.
For further information regarding potential cooperation,
please call us or make callback request.
please call us or make callback request.