Note: This section contains information in English only.
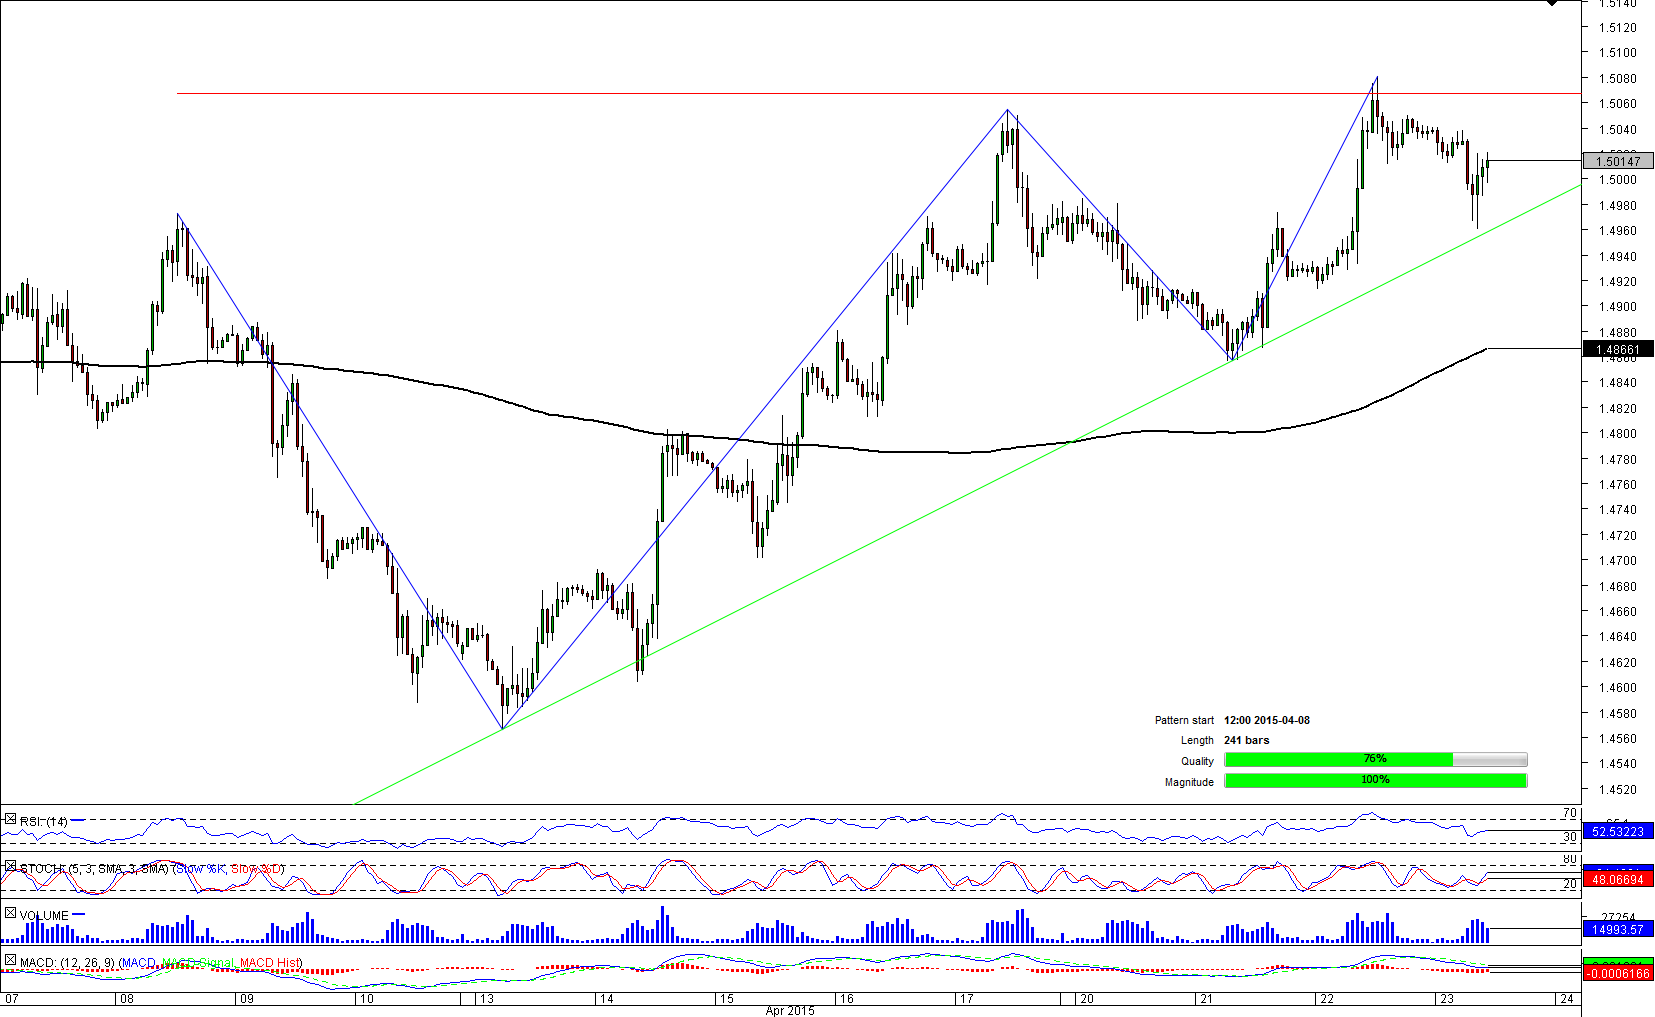
 After bottoming out at 1.4567 on April 13, the Cable commenced a recovery, even though gains are still limited by a resistance at 1.5067. Therefore, GBP/USD has formed an ascending triangle pattern on an hourly chart, and is currently respecting two boundaries of it. In the short-term, this currency pair is expected to show slight weakness, judging from near-term technical indicators. However, after hitting the lower trend-line, which is reinforced by 100-hour SMA and daily S1, the Sterling is forecasted to rebound significantly and target 1.5160 (weekly R1) towards the end of this week. Despite that, 60% of SWFX traders are bearish on perspectives of the British Pound.

Thu, 23 Apr 2015 12:46:04 GMT
Source: Dukascopy Bank SA
© Dukascopy Bank SA
© Dukascopy Bank SA
Actual Topics
Subscribe to "Fundamental Analysis" feed
Souscrire
To learn more about Dukascopy Bank CFD / Forex trading platform, SWFX and other trading related information,
please call us or make callback request.
please call us or make callback request.
For further information regarding potential cooperation,
please call us or make callback request.
please call us or make callback request.
To learn more about Dukascopy Bank Binary Options
/ Forex trading platform, SWFX and other trading related information,
please call us or make callback request.
please call us or make callback request.
To learn more about Dukascopy Bank CFD / Forex trading platform, SWFX and other trading related information,
please call us or make callback request.
please call us or make callback request.
To learn more about Crypto Trading / CFD / Forex trading platform, SWFX and other trading related information,
please call us or make callback request.
please call us or make callback request.
To learn more about Business Introducer and other trading related information,
please call us or make callback request.
please call us or make callback request.
For further information regarding potential cooperation,
please call us or make callback request.
please call us or make callback request.