Meanwhile, the technical indicators are mixed, with a slight bearish bias on the weekly chart. The nearest support level is at 1.0566, created by the weekly S1 and monthly PP, while a more significant demand area is at 1.0450, followed by the monthly S2 at 1.02.
Note: This section contains information in English only.
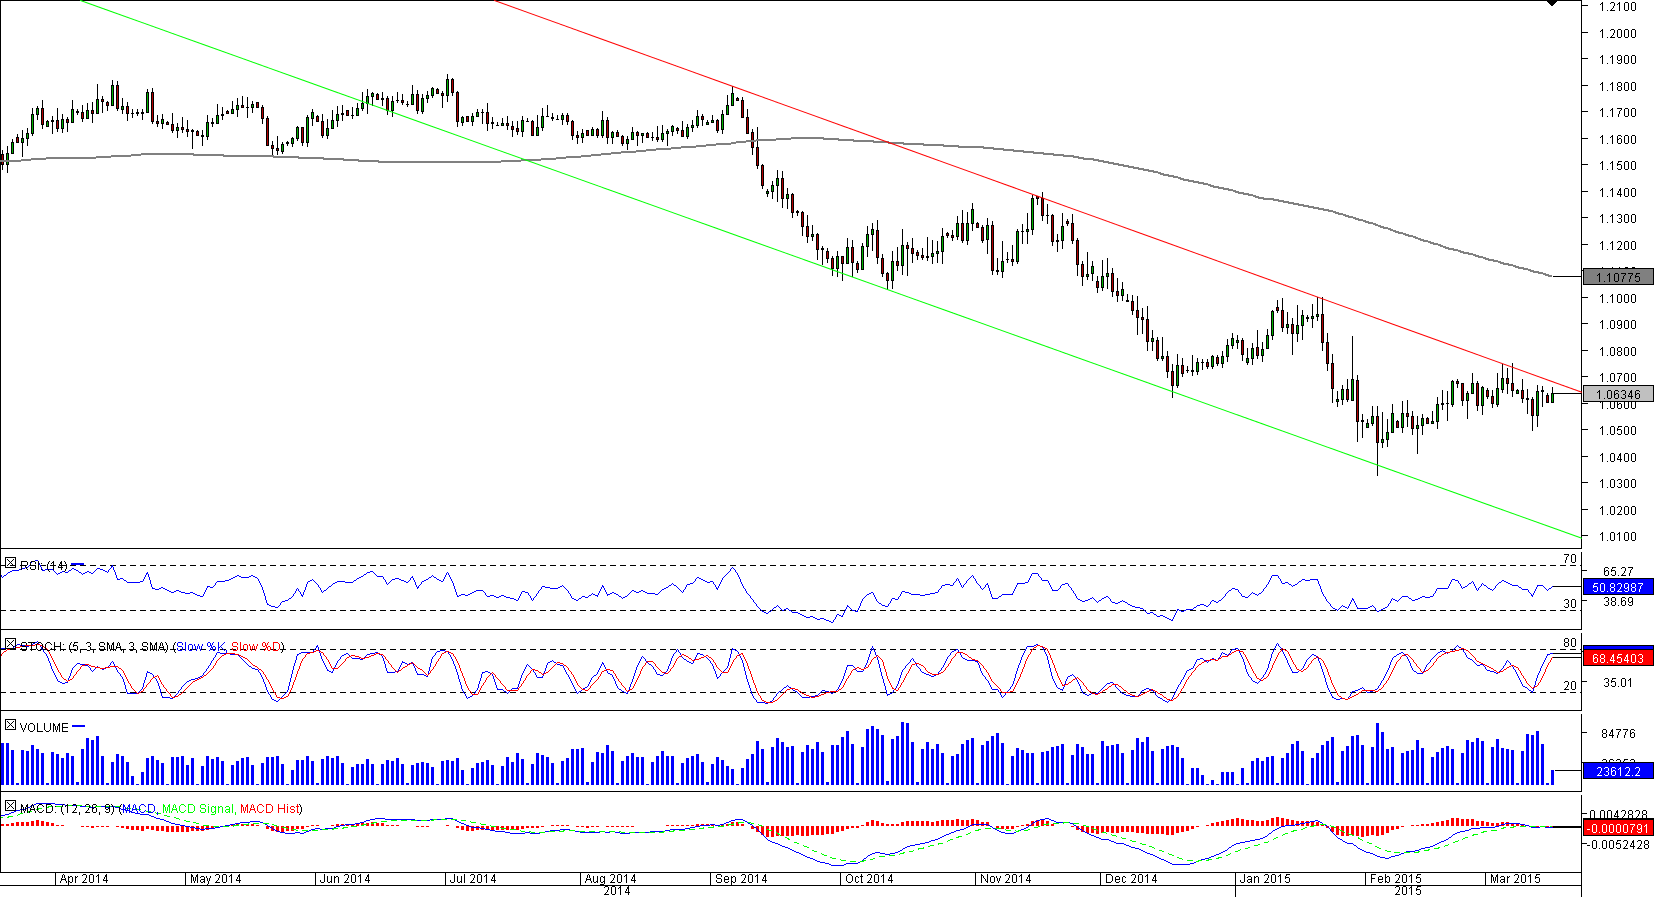
 The Australian Dollar is a sell at the moment. First, AUD/SGD has formed a well-defined bearish channel during the last 10 months. Second, the currency pair is trading next to the long-term trend-line at 1.07, reinforced by the weekly R1 and some of the recent highs. However, 73% of open positions are short, meaning the Aussie may be already oversold.
Meanwhile, the technical indicators are mixed, with a slight bearish bias on the weekly chart. The nearest support level is at 1.0566, created by the weekly S1 and monthly PP, while a more significant demand area is at 1.0450, followed by the monthly S2 at 1.02.

Mon, 16 Mar 2015 08:56:04 GMT
Source: Dukascopy Bank SA
© Dukascopy Bank SA
Meanwhile, the technical indicators are mixed, with a slight bearish bias on the weekly chart. The nearest support level is at 1.0566, created by the weekly S1 and monthly PP, while a more significant demand area is at 1.0450, followed by the monthly S2 at 1.02.
© Dukascopy Bank SA
Actual Topics
Subscribe to "Fundamental Analysis" feed
Souscrire
To learn more about Dukascopy Bank CFD / Forex trading platform, SWFX and other trading related information,
please call us or make callback request.
please call us or make callback request.
For further information regarding potential cooperation,
please call us or make callback request.
please call us or make callback request.
To learn more about Dukascopy Bank Binary Options
/ Forex trading platform, SWFX and other trading related information,
please call us or make callback request.
please call us or make callback request.
To learn more about Dukascopy Bank CFD / Forex trading platform, SWFX and other trading related information,
please call us or make callback request.
please call us or make callback request.
To learn more about Crypto Trading / CFD / Forex trading platform, SWFX and other trading related information,
please call us or make callback request.
please call us or make callback request.
To learn more about Business Introducer and other trading related information,
please call us or make callback request.
please call us or make callback request.
For further information regarding potential cooperation,
please call us or make callback request.
please call us or make callback request.