Note: This section contains information in English only.
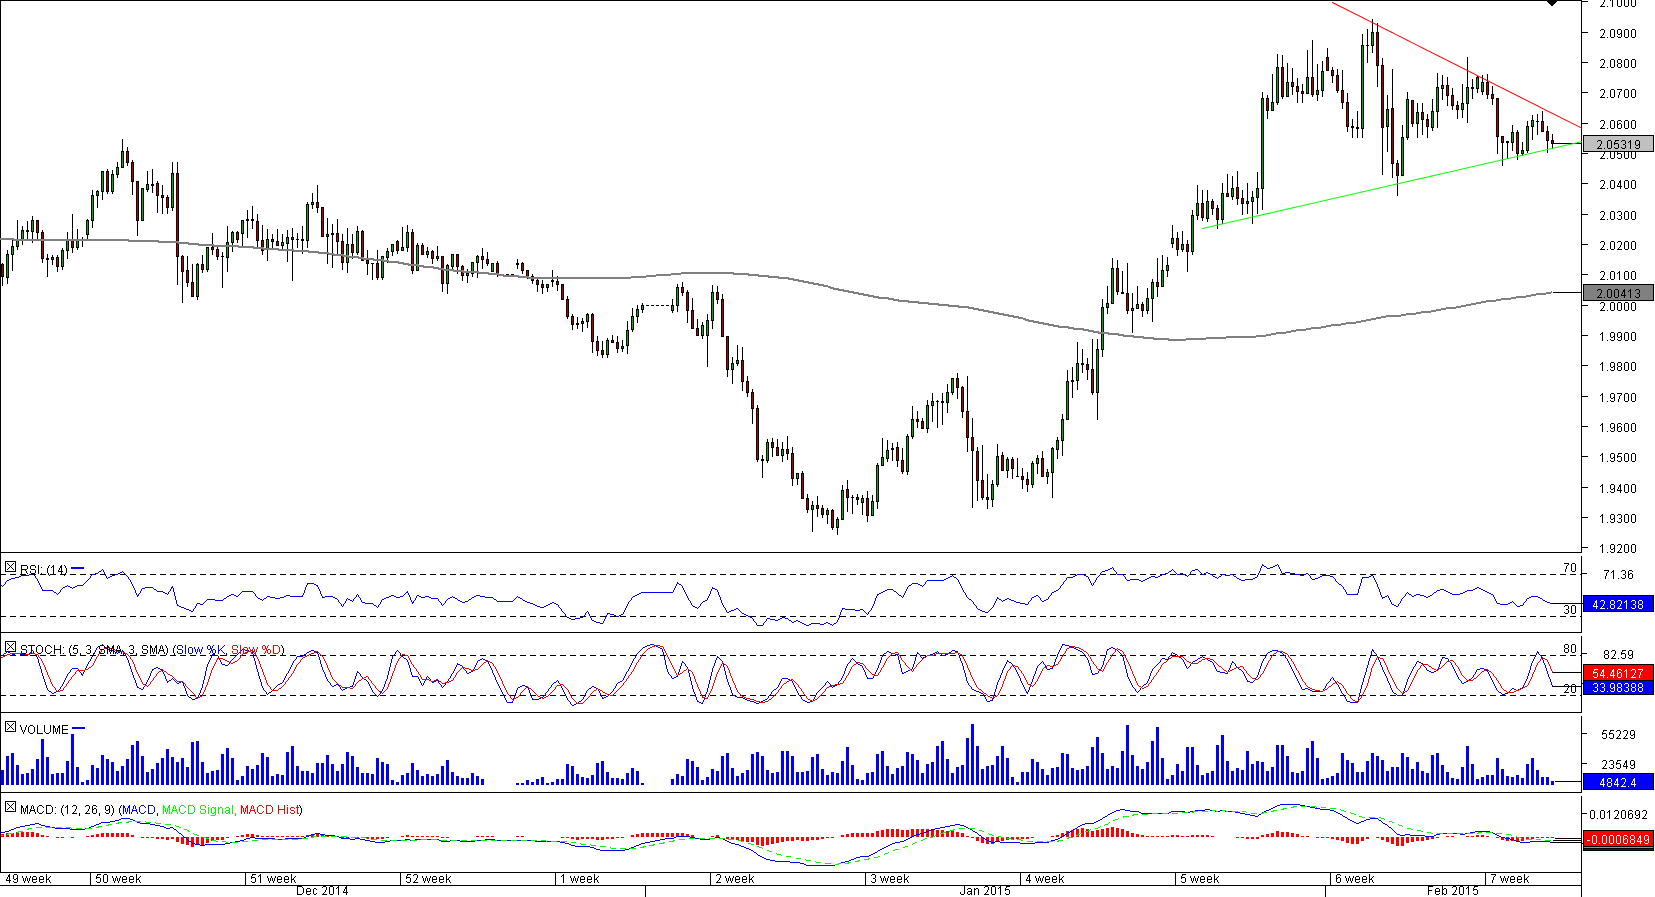
 After forming a double bottom and rallying from 1.94 up to 2.09 in two weeks, GBP/NZD is now consolidating. The pair has recently formed a symmetrical triangle, and the bullish momentum should soon return. Once the price closes above the falling resistance trend-line, currently at 2.06, the target will be set at the February high, though the Sterling may well attempt to challenge the 2014 peak at 2.1060. The positive medium-term outlook is reinforced by the technical indicators on the daily chart, six out of eight are pointing up. In case the up-trend at 2.05 is violated first, there is a strong demand zone at 2.03, where the 38.2% Fibonacci retracement merges with the monthly pivot point.

Wed, 11 Feb 2015 07:06:41 GMT
Source: Dukascopy Bank SA
© Dukascopy Bank SA
© Dukascopy Bank SA
Actual Topics
Subscribe to "Fundamental Analysis" feed
Souscrire
To learn more about Dukascopy Bank CFD / Forex trading platform, SWFX and other trading related information,
please call us or make callback request.
please call us or make callback request.
For further information regarding potential cooperation,
please call us or make callback request.
please call us or make callback request.
To learn more about Dukascopy Bank Binary Options
/ Forex trading platform, SWFX and other trading related information,
please call us or make callback request.
please call us or make callback request.
To learn more about Dukascopy Bank CFD / Forex trading platform, SWFX and other trading related information,
please call us or make callback request.
please call us or make callback request.
To learn more about Crypto Trading / CFD / Forex trading platform, SWFX and other trading related information,
please call us or make callback request.
please call us or make callback request.
To learn more about Business Introducer and other trading related information,
please call us or make callback request.
please call us or make callback request.
For further information regarding potential cooperation,
please call us or make callback request.
please call us or make callback request.