However, it is worth noticing that at the same time the trading range is decreasing, meaning the pair may be forming a falling wedge—a sign there soon may be a reversal. Still, we must point out the low quality of the pattern because of the white space in November, when AUD/NZD did not confirm the lower trend-line even once.
Note: This section contains information in English only.
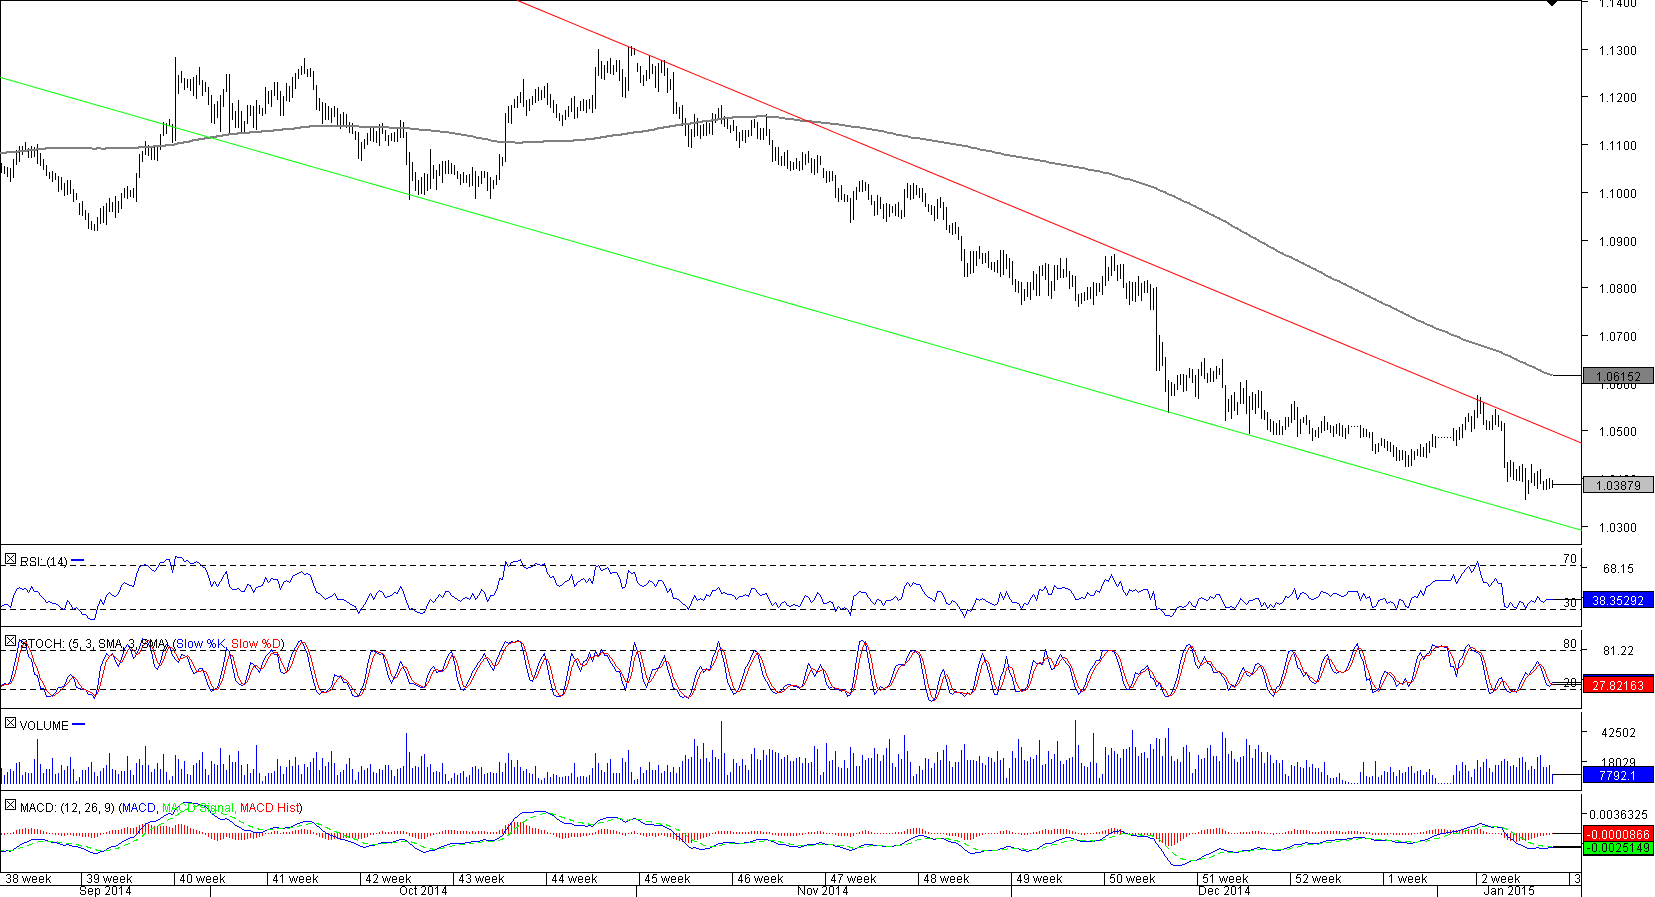
 After encountering the resistance at 1.13 AUD/NZD has been under constant selling pressure, falling 3.15% since Nov 1. According to the technical indicators on the four-hour and weekly charts, the downward momentum is likely to persist in the future.
However, it is worth noticing that at the same time the trading range is decreasing, meaning the pair may be forming a falling wedge—a sign there soon may be a reversal. Still, we must point out the low quality of the pattern because of the white space in November, when AUD/NZD did not confirm the lower trend-line even once.

Fri, 09 Jan 2015 07:13:15 GMT
Source: Dukascopy Bank SA
© Dukascopy Bank SA
However, it is worth noticing that at the same time the trading range is decreasing, meaning the pair may be forming a falling wedge—a sign there soon may be a reversal. Still, we must point out the low quality of the pattern because of the white space in November, when AUD/NZD did not confirm the lower trend-line even once.
© Dukascopy Bank SA
Actual Topics
Subscribe to "Fundamental Analysis" feed
Souscrire
To learn more about Dukascopy Bank CFD / Forex trading platform, SWFX and other trading related information,
please call us or make callback request.
please call us or make callback request.
For further information regarding potential cooperation,
please call us or make callback request.
please call us or make callback request.
To learn more about Dukascopy Bank Binary Options
/ Forex trading platform, SWFX and other trading related information,
please call us or make callback request.
please call us or make callback request.
To learn more about Dukascopy Bank CFD / Forex trading platform, SWFX and other trading related information,
please call us or make callback request.
please call us or make callback request.
To learn more about Crypto Trading / CFD / Forex trading platform, SWFX and other trading related information,
please call us or make callback request.
please call us or make callback request.
To learn more about Business Introducer and other trading related information,
please call us or make callback request.
please call us or make callback request.
For further information regarding potential cooperation,
please call us or make callback request.
please call us or make callback request.