Now the instrument is unremittingly nearing the neck-line at 0.8638 that represents a formidable resistance level bolstered by the daily R1 and four-hour R1. If the pair manages not to lose its spree and surpass this level, it may enjoy a rally that is not likely to be contained up to the next resistance at 0.8655 (200-hour SMA).
Note: This section contains information in English only.
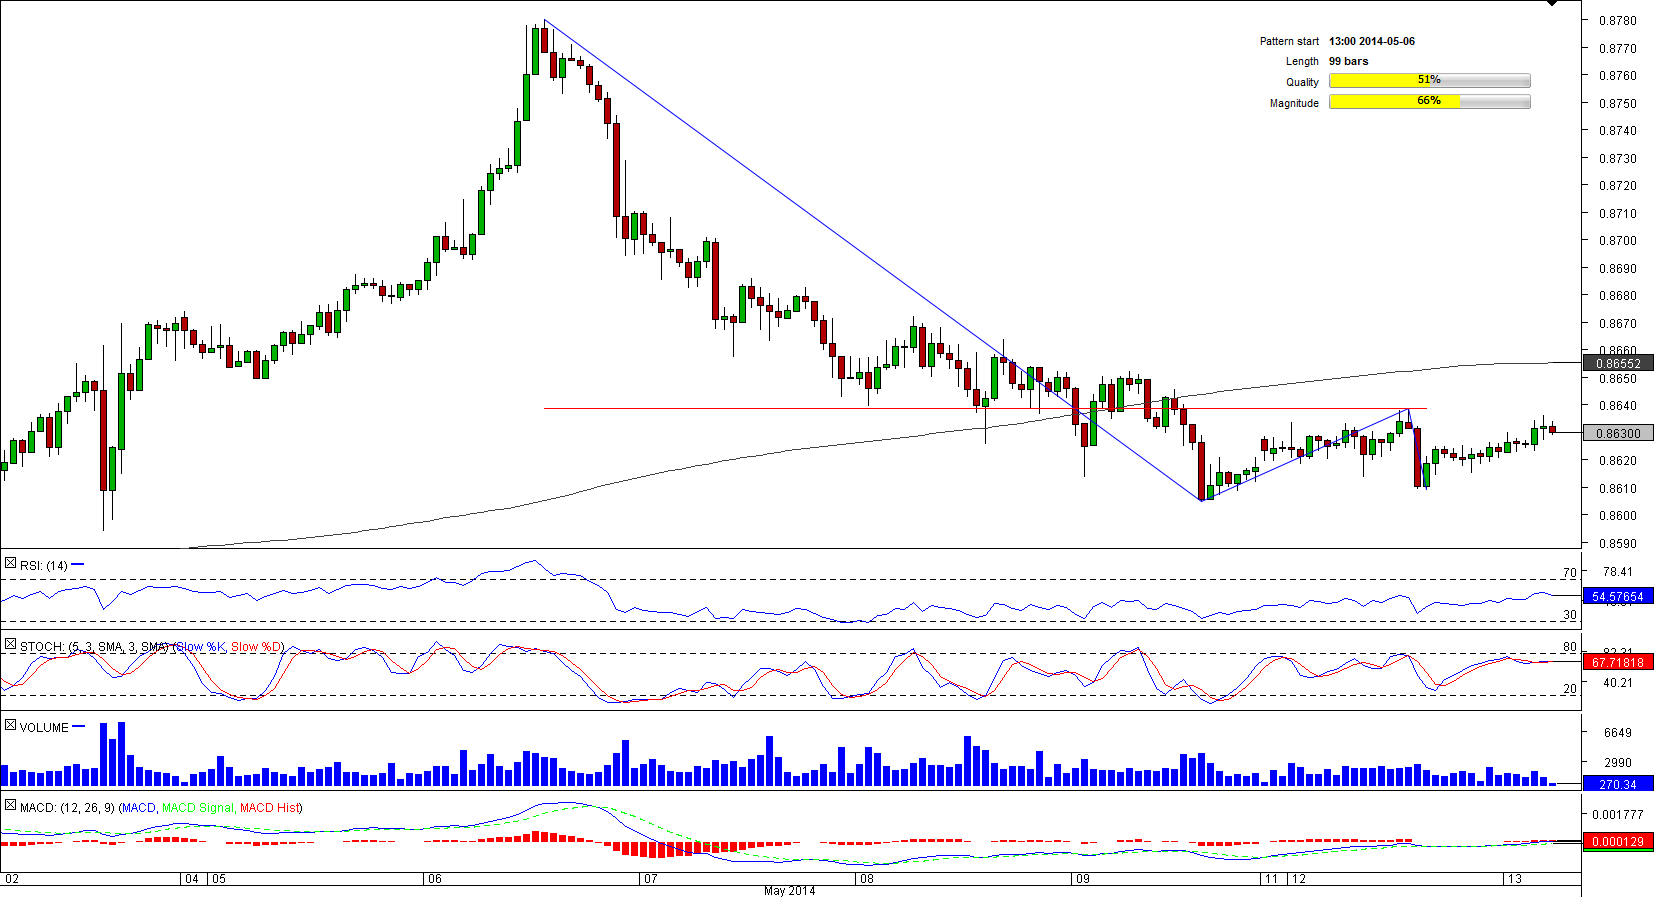
 A rise to a three-year high of 0.87796 early May provoked a sharp depreciation of the New Zealand Dollar against its U.S. peer. The decline was a part of the 99-bar long double bottom pattern, inside which the pair is located at the moment.
Now the instrument is unremittingly nearing the neck-line at 0.8638 that represents a formidable resistance level bolstered by the daily R1 and four-hour R1. If the pair manages not to lose its spree and surpass this level, it may enjoy a rally that is not likely to be contained up to the next resistance at 0.8655 (200-hour SMA).

Tue, 13 May 2014 07:23:04 GMT
Source: Dukascopy Bank SA
© Dukascopy Bank SA
Now the instrument is unremittingly nearing the neck-line at 0.8638 that represents a formidable resistance level bolstered by the daily R1 and four-hour R1. If the pair manages not to lose its spree and surpass this level, it may enjoy a rally that is not likely to be contained up to the next resistance at 0.8655 (200-hour SMA).
© Dukascopy Bank SA
Actual Topics
Subscribe to "Fundamental Analysis" feed
Souscrire
To learn more about Dukascopy Bank CFD / Forex trading platform, SWFX and other trading related information,
please call us or make callback request.
please call us or make callback request.
For further information regarding potential cooperation,
please call us or make callback request.
please call us or make callback request.
To learn more about Dukascopy Bank Binary Options
/ Forex trading platform, SWFX and other trading related information,
please call us or make callback request.
please call us or make callback request.
To learn more about Dukascopy Bank CFD / Forex trading platform, SWFX and other trading related information,
please call us or make callback request.
please call us or make callback request.
To learn more about Crypto Trading / CFD / Forex trading platform, SWFX and other trading related information,
please call us or make callback request.
please call us or make callback request.
To learn more about Business Introducer and other trading related information,
please call us or make callback request.
please call us or make callback request.
For further information regarding potential cooperation,
please call us or make callback request.
please call us or make callback request.