However, now the era of losses seems to have come to an end as the pair finally managed to surpass the neck-line at 93.01 that means the breakout may have happened and as a result a sharp appreciation may lie ahead. Technical indicators support this idea, sending ‘buy' signals for the short and long terms.
Note: This section contains information in English only.
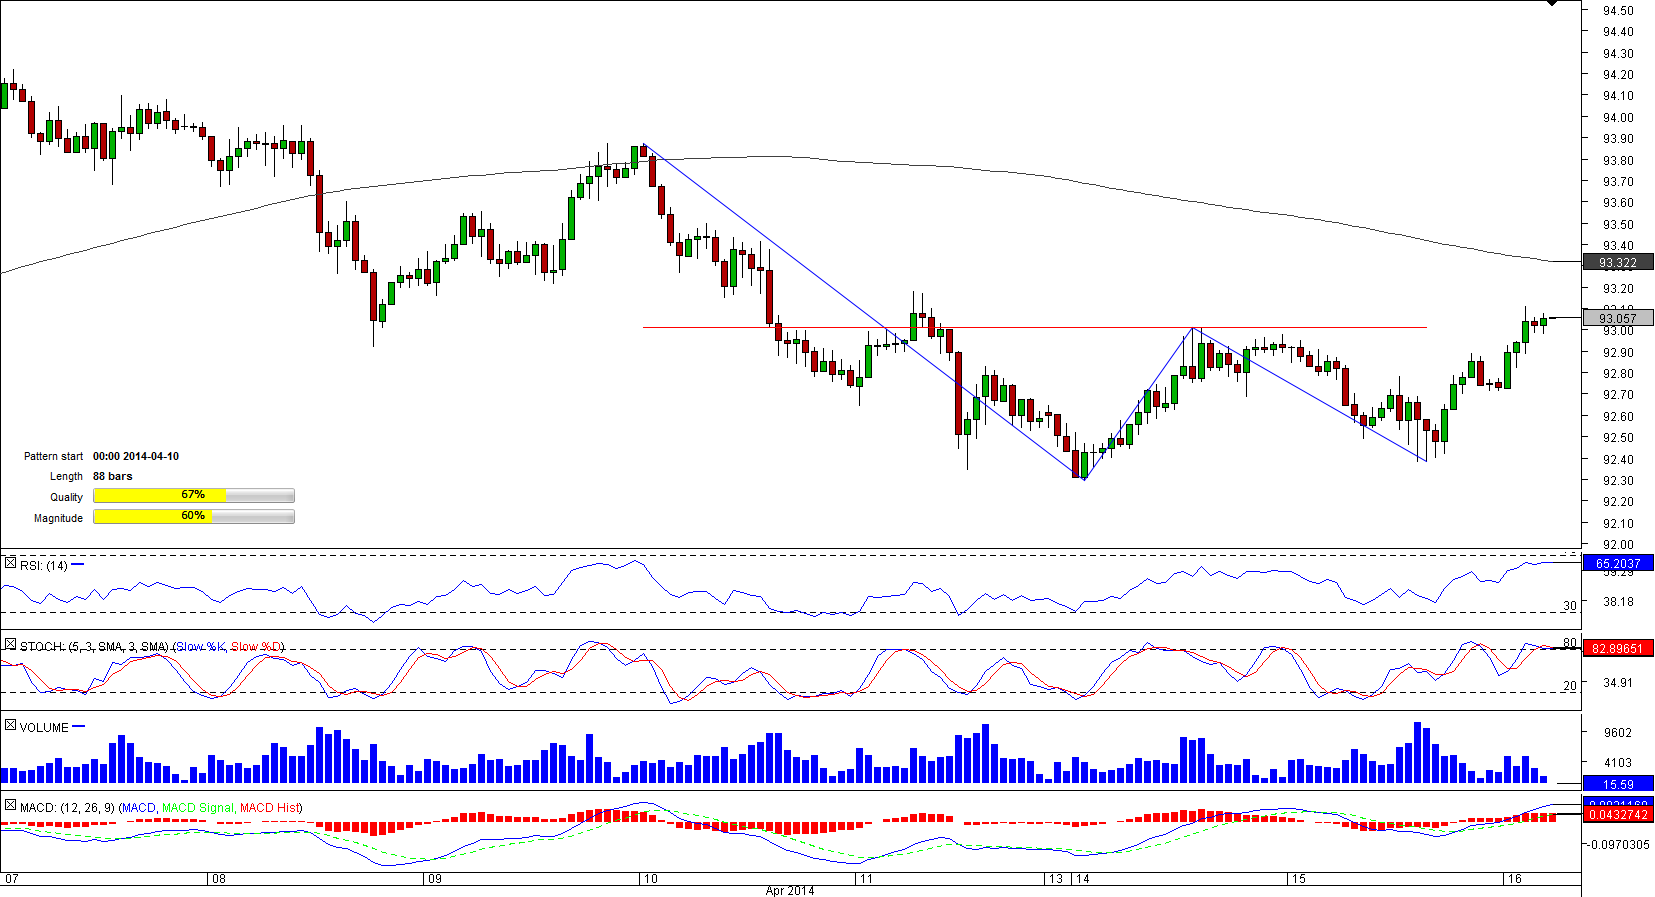
 A two-week rally that took CAD/JPY to more than a two-month high of 94.90 ended in the very beginning of April when the pair started an accelerating decline. The 88-bar long double bottom pattern being currently formed by the instrument also is a part of this long-lasting weakness.
However, now the era of losses seems to have come to an end as the pair finally managed to surpass the neck-line at 93.01 that means the breakout may have happened and as a result a sharp appreciation may lie ahead. Technical indicators support this idea, sending ‘buy' signals for the short and long terms.

Wed, 16 Apr 2014 06:34:32 GMT
Source: Dukascopy Bank SA
© Dukascopy Bank SA
However, now the era of losses seems to have come to an end as the pair finally managed to surpass the neck-line at 93.01 that means the breakout may have happened and as a result a sharp appreciation may lie ahead. Technical indicators support this idea, sending ‘buy' signals for the short and long terms.
© Dukascopy Bank SA
Actual Topics
Subscribe to "Fundamental Analysis" feed
Souscrire
To learn more about Dukascopy Bank CFD / Forex trading platform, SWFX and other trading related information,
please call us or make callback request.
please call us or make callback request.
For further information regarding potential cooperation,
please call us or make callback request.
please call us or make callback request.
To learn more about Dukascopy Bank Binary Options
/ Forex trading platform, SWFX and other trading related information,
please call us or make callback request.
please call us or make callback request.
To learn more about Dukascopy Bank CFD / Forex trading platform, SWFX and other trading related information,
please call us or make callback request.
please call us or make callback request.
To learn more about Crypto Trading / CFD / Forex trading platform, SWFX and other trading related information,
please call us or make callback request.
please call us or make callback request.
To learn more about Business Introducer and other trading related information,
please call us or make callback request.
please call us or make callback request.
For further information regarding potential cooperation,
please call us or make callback request.
please call us or make callback request.