Note: This section contains information in English only.
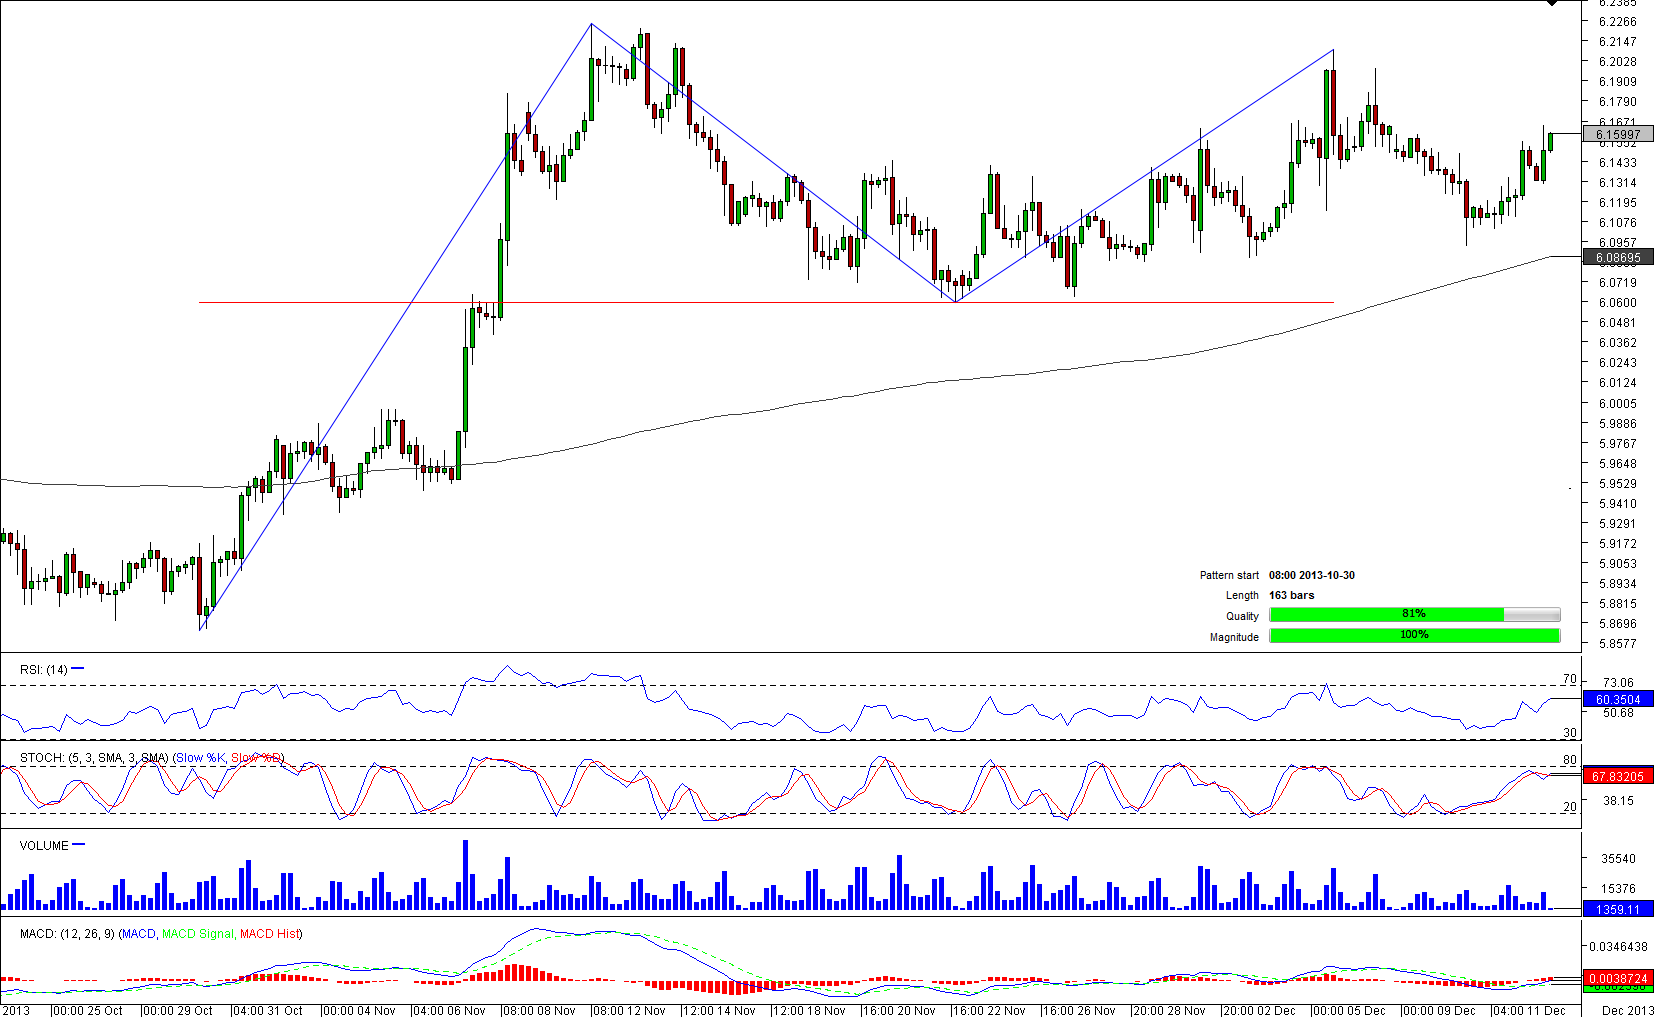
 The USD/NOK has rallied since October 30, however, after hitting pattern's resistance and November's high, the rally paused and since then the pair has been fluctuating between two trend lines. Despite the sideways movement, the pair still has a potential for further appreciation, as from the downside it is bounded by a strong support line and a 200-period SMA. Moreover, even lower is located a 23.60% Fibonacci retracement. Technical indicators are sending "buy" signals on 4H and daily charts, suggesting the short and medium-term outlooks are bullish. Therefore, a retest of a weekly R1 and recent high at 6.2108 is expected.

Thu, 12 Dec 2013 14:28:27 GMT
Source: Dukascopy Bank SA
© Dukascopy Bank SA
© Dukascopy Bank SA
Actual Topics
Subscribe to "Fundamental Analysis" feed
Souscrire
To learn more about Dukascopy Bank CFD / Forex trading platform, SWFX and other trading related information,
please call us or make callback request.
please call us or make callback request.
For further information regarding potential cooperation,
please call us or make callback request.
please call us or make callback request.
To learn more about Dukascopy Bank Binary Options
/ Forex trading platform, SWFX and other trading related information,
please call us or make callback request.
please call us or make callback request.
To learn more about Dukascopy Bank CFD / Forex trading platform, SWFX and other trading related information,
please call us or make callback request.
please call us or make callback request.
To learn more about Crypto Trading / CFD / Forex trading platform, SWFX and other trading related information,
please call us or make callback request.
please call us or make callback request.
To learn more about Business Introducer and other trading related information,
please call us or make callback request.
please call us or make callback request.
For further information regarding potential cooperation,
please call us or make callback request.
please call us or make callback request.