Note: This section contains information in English only.
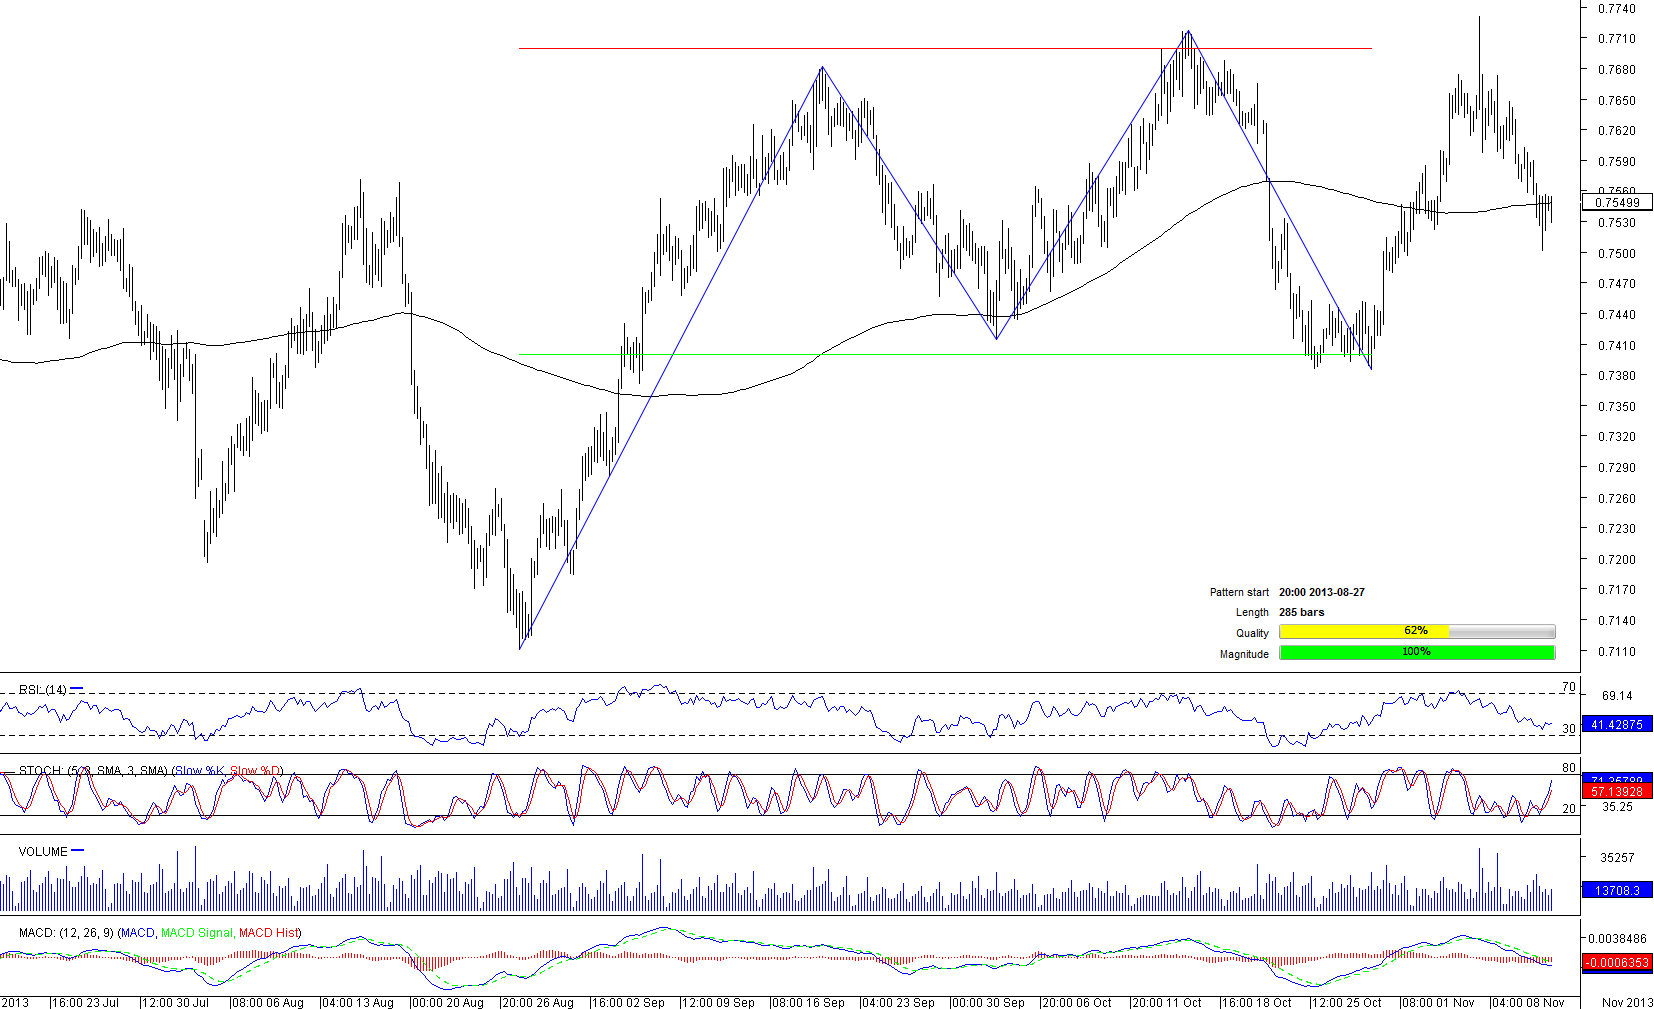
 Another rectangle was formed by NZD/CHF on August 27, when the pair soared from 0.711. Since then the pair has been bounded between two parallel trend lines, in a 300 pips range. Though technical indicators are not univocal, the fact that each new high was higher than the previous one, is suggesting bulls would be able to penetrate the resistance line. At the moment of writing, the pair is stuck around 200-period SMA, suggesting it is a key level in the short term. A move above this level would put 0.7621 on the map, while in case a movement below the 200-period SMA, short traders could focus on 0.7512. Meanwhile, 73% of traders are holding short positions.

Wed, 13 Nov 2013 13:30:12 GMT
Source: Dukascopy Bank SA
© Dukascopy Bank SA
© Dukascopy Bank SA
Actual Topics
Subscribe to "Fundamental Analysis" feed
Souscrire
To learn more about Dukascopy Bank CFD / Forex trading platform, SWFX and other trading related information,
please call us or make callback request.
please call us or make callback request.
For further information regarding potential cooperation,
please call us or make callback request.
please call us or make callback request.
To learn more about Dukascopy Bank Binary Options
/ Forex trading platform, SWFX and other trading related information,
please call us or make callback request.
please call us or make callback request.
To learn more about Dukascopy Bank CFD / Forex trading platform, SWFX and other trading related information,
please call us or make callback request.
please call us or make callback request.
To learn more about Crypto Trading / CFD / Forex trading platform, SWFX and other trading related information,
please call us or make callback request.
please call us or make callback request.
To learn more about Business Introducer and other trading related information,
please call us or make callback request.
please call us or make callback request.
For further information regarding potential cooperation,
please call us or make callback request.
please call us or make callback request.