Note: This section contains information in English only.
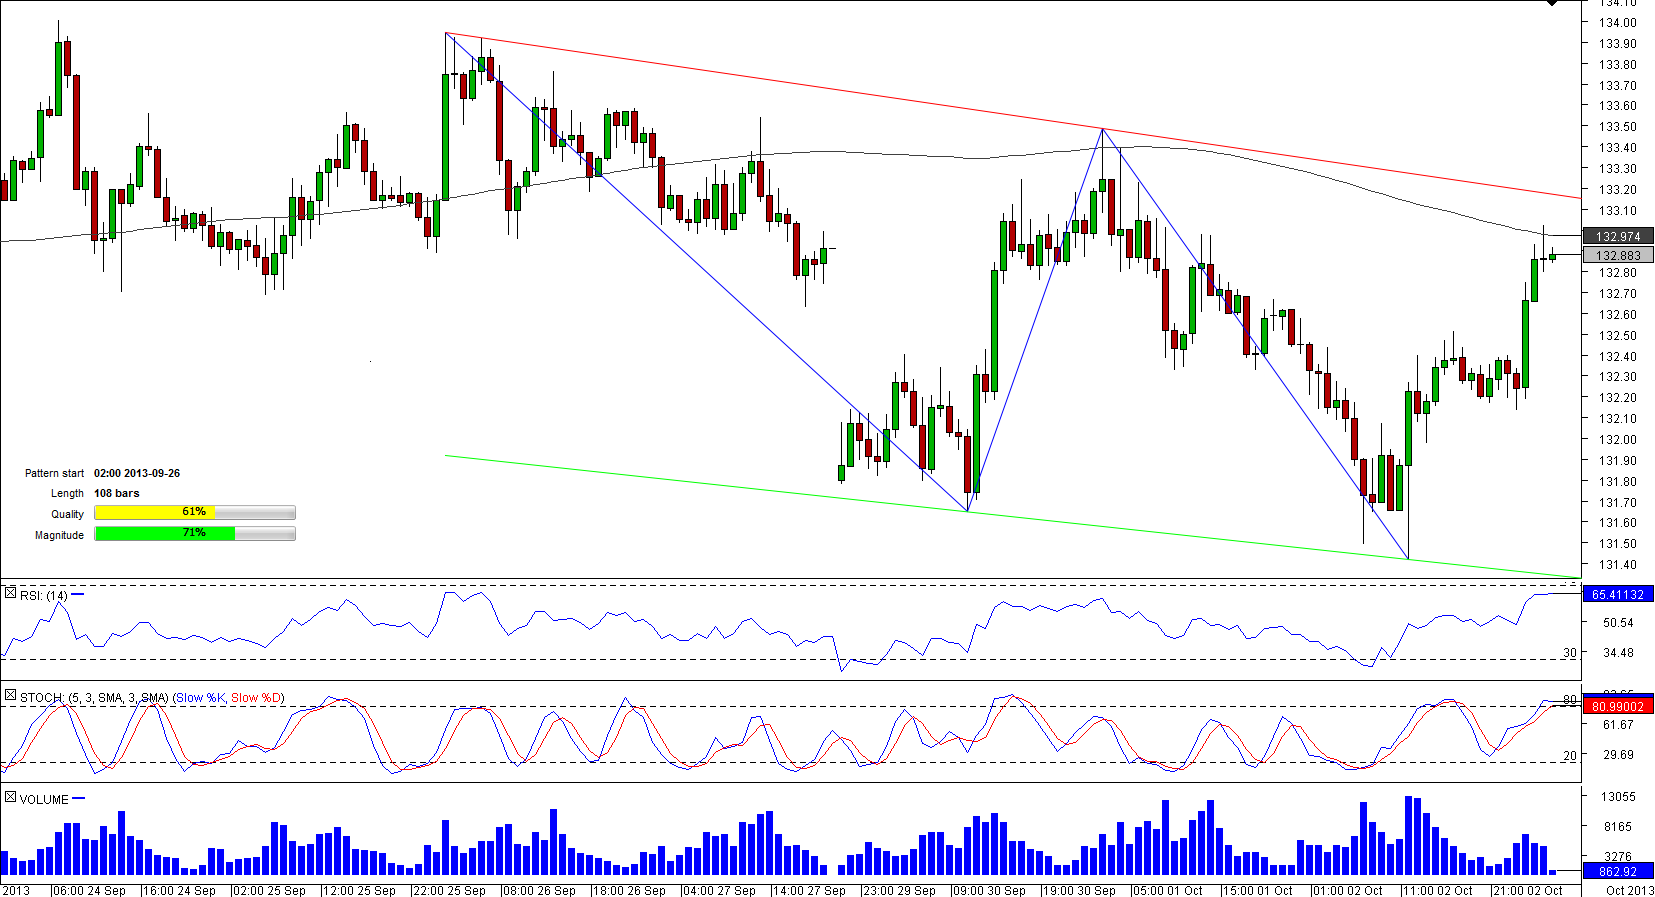
 After hitting more than a one-year high of 133.91, EUR/JPY commenced to decline; however, the channel down pattern started being formed only on September 26 when the 50-hour SMA fell below 200-hour SMA. The currency pair was erratic, fluctuating in a 250-pip wide range. Currently, the Euro is struggling at its 200-hour SMA at 132.93 and may overcome this level as expected by the market participants, 62.50% of whom are bullish on the pair. If the pair breaches its 200-hour SMA that is acting as a strong resistance it may target a pattern's upper-limit, a jump above which is likely to incite a sharp rally of the single currency against the Yen.

Thu, 03 Oct 2013 06:02:28 GMT
Source: Dukascopy Bank SA
© Dukascopy Bank SA
© Dukascopy Bank SA
Actual Topics
Subscribe to "Fundamental Analysis" feed
Souscrire
To learn more about Dukascopy Bank CFD / Forex trading platform, SWFX and other trading related information,
please call us or make callback request.
please call us or make callback request.
For further information regarding potential cooperation,
please call us or make callback request.
please call us or make callback request.
To learn more about Dukascopy Bank Binary Options
/ Forex trading platform, SWFX and other trading related information,
please call us or make callback request.
please call us or make callback request.
To learn more about Dukascopy Bank CFD / Forex trading platform, SWFX and other trading related information,
please call us or make callback request.
please call us or make callback request.
To learn more about Crypto Trading / CFD / Forex trading platform, SWFX and other trading related information,
please call us or make callback request.
please call us or make callback request.
To learn more about Business Introducer and other trading related information,
please call us or make callback request.
please call us or make callback request.
For further information regarding potential cooperation,
please call us or make callback request.
please call us or make callback request.