Note: This section contains information in English only.
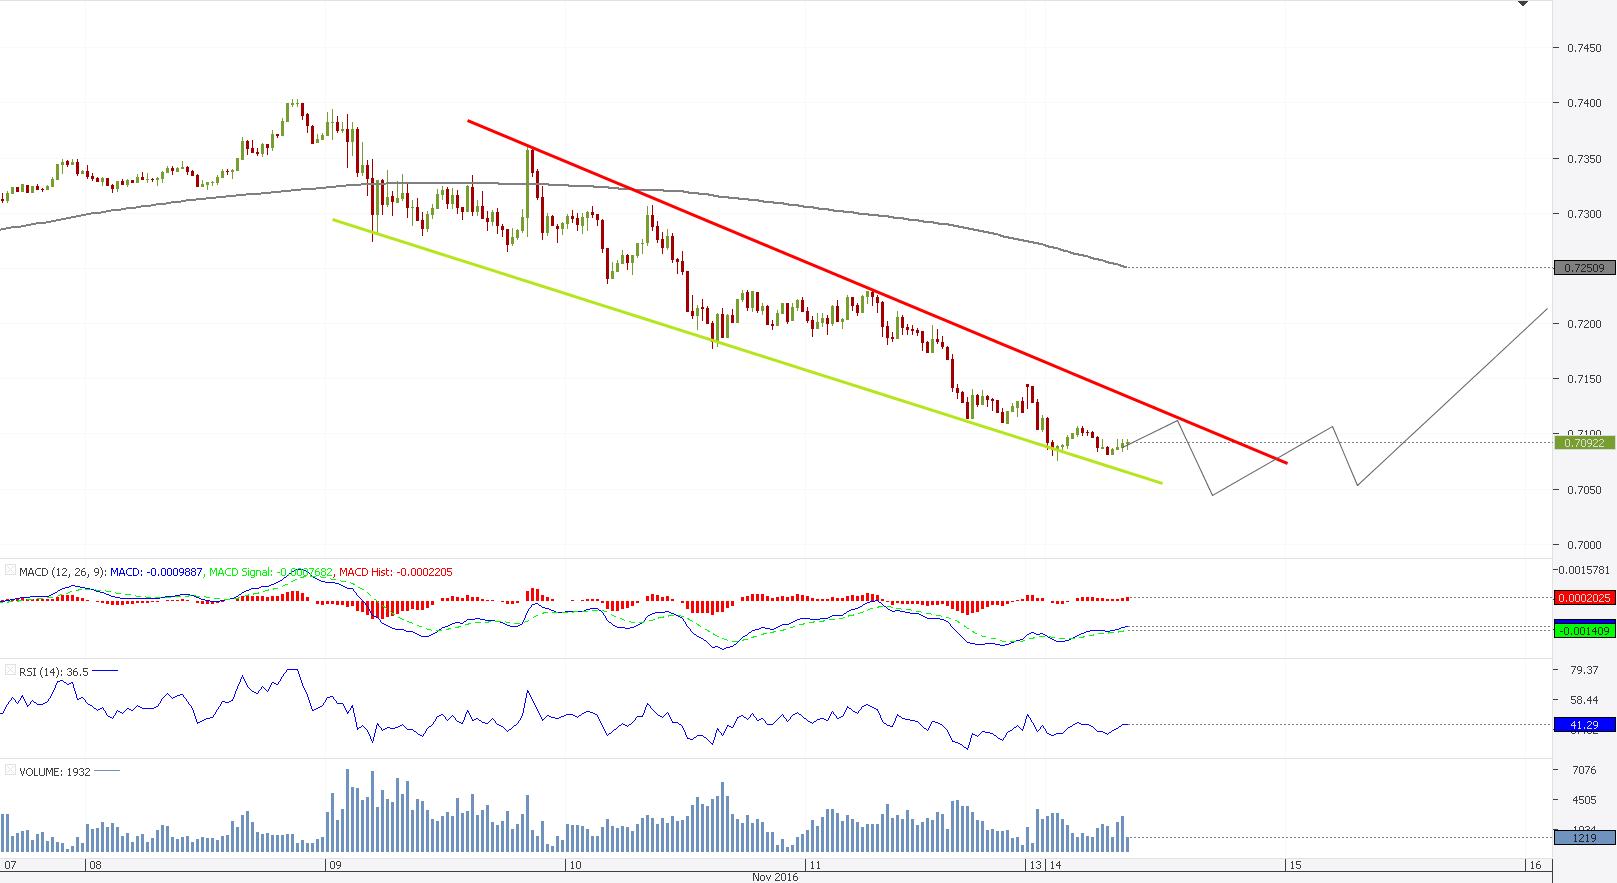
 NZD/USD gained bullish potential inside of a falling wedge pattern, as highs became higher but volatility was lost on the downside. Currently moving towards 0.7115, the upper trend-line of the wedge, the pair will encounter supply at 0.7099, where the 20-period SMA lies. With SMAs weighing from above, the pair will face a tough journey that will eventually lead outside of the upper boundary. Short-term dips will be cut by 0.7078/76 with more risk at 0.7065, the bottom trend-line of the wedge. We see the pair respecting the bounds of the wedge up until the 0.7037 level, represented by October lows, is reached, followed by a break out of the pattern right after that.

Mon, 14 Nov 2016 09:50:03 GMT
Source: Dukascopy Bank SA
© Dukascopy Bank SA
© Dukascopy Bank SA
Actual Topics
Subscribe to "Fundamental Analysis" feed
Subscribe
Per scoprire di più sulla piattaforma di Dukascopy Bank per Forex/CFD, sul SWFX ed altre informazioni relative al trading,
la preghiamo di contattarci o richiedere di essere contattato (callback request)
la preghiamo di contattarci o richiedere di essere contattato (callback request)
For further information regarding potential cooperation,
please call us or make callback request.
please call us or make callback request.
To learn more about Dukascopy Bank Binary Options
/ Forex trading platform, SWFX and other trading related information,
please call us or make callback request.
please call us or make callback request.
Per scoprire di più sulla piattaforma di Dukascopy Bank per Forex/CFD, sul SWFX ed altre informazioni relative al trading,
la preghiamo di contattarci o richiedere di essere contattato (callback request).
la preghiamo di contattarci o richiedere di essere contattato (callback request).
To learn more about Crypto Trading / CFD / Forex trading platform, SWFX and other trading related information,
please call us or make callback request.
please call us or make callback request.
To learn more about Business Introducer and other trading related information,
please call us or make callback request.
please call us or make callback request.
For further information regarding potential cooperation,
please call us or make callback request.
please call us or make callback request.