Note: This section contains information in English only.
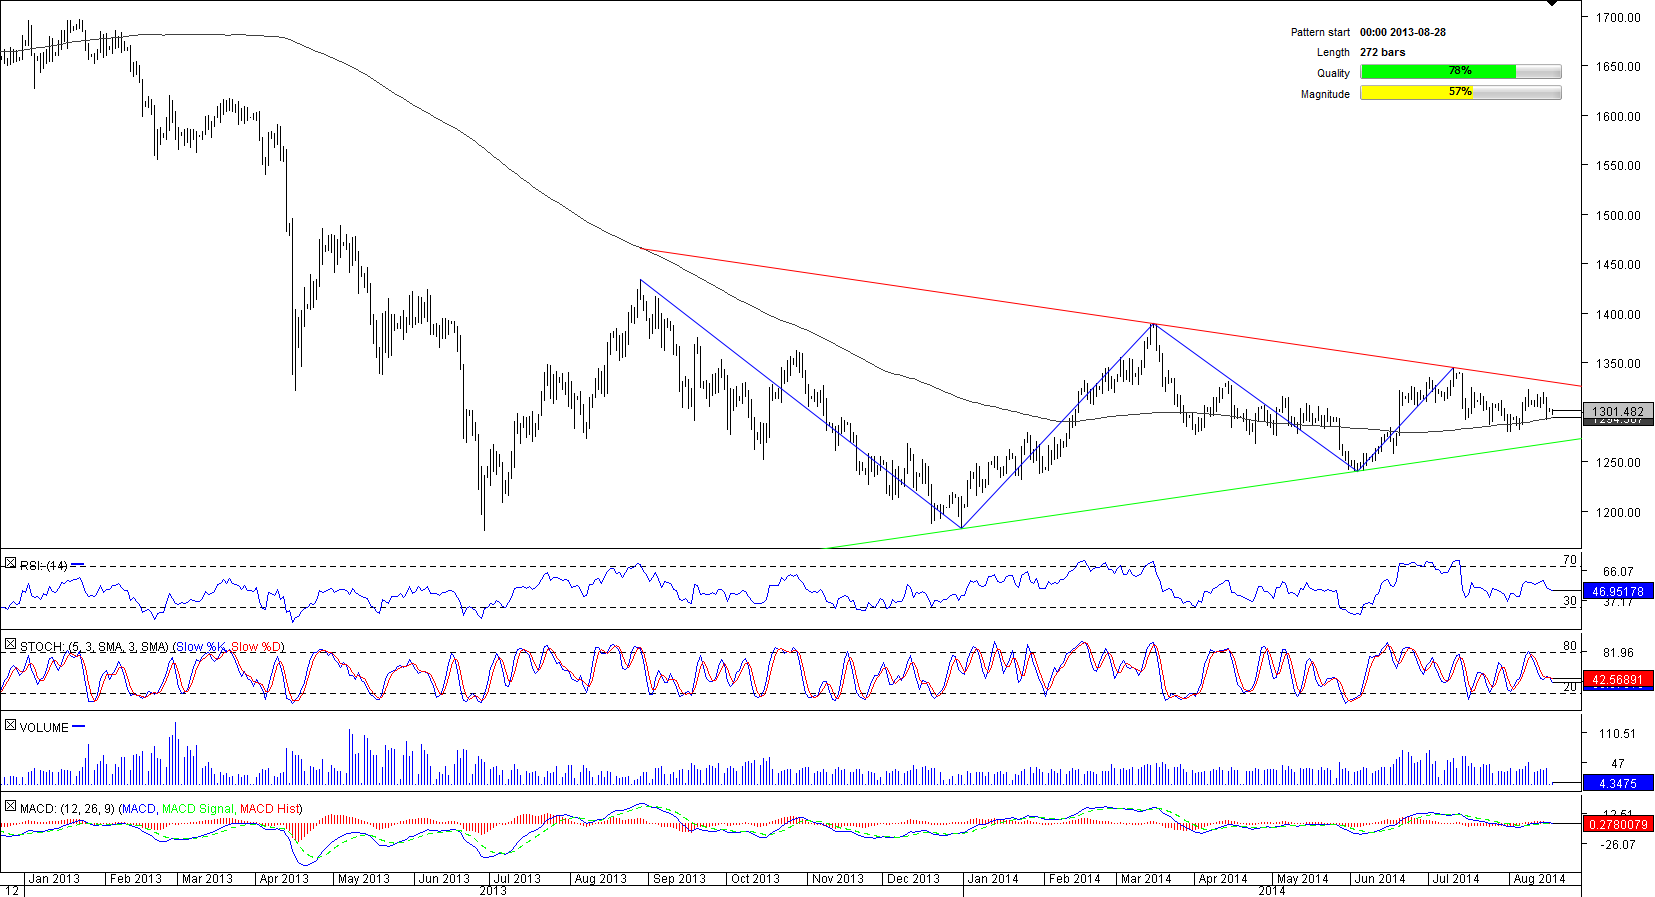
 One can see the outlines of a symmetrical triangle on the daily chart of XAU/USD. After a precipitous decline (from 1,800 to 1,200), in the third quarter of 2013 the price entered a correction phase, which later on developed into a continuation pattern. Consequently, the gold is more likely to break the up-trend support line at 1,280 and resume depreciation than to violate the falling line at 1,325. The first scenario implies a decline through Jun 3 low at 1,240 towards the Dec 31 low near 1,180. The targets for an alternative scenario are going to be the Jul 10 high at 1,345.50 and Mar 16 high at 1,390. Meanwhile, the SWFX traders are undecided—56% of open positions are long.

Mon, 18 Aug 2014 07:15:42 GMT
Source: Dukascopy Bank SA
© Dukascopy Bank SA
© Dukascopy Bank SA
Actual Topics
Subscribe to "Fundamental Analysis" feed
Subscribe
Per scoprire di più sulla piattaforma di Dukascopy Bank per Forex/CFD, sul SWFX ed altre informazioni relative al trading,
la preghiamo di contattarci o richiedere di essere contattato (callback request)
la preghiamo di contattarci o richiedere di essere contattato (callback request)
For further information regarding potential cooperation,
please call us or make callback request.
please call us or make callback request.
To learn more about Dukascopy Bank Binary Options
/ Forex trading platform, SWFX and other trading related information,
please call us or make callback request.
please call us or make callback request.
Per scoprire di più sulla piattaforma di Dukascopy Bank per Forex/CFD, sul SWFX ed altre informazioni relative al trading,
la preghiamo di contattarci o richiedere di essere contattato (callback request).
la preghiamo di contattarci o richiedere di essere contattato (callback request).
To learn more about Crypto Trading / CFD / Forex trading platform, SWFX and other trading related information,
please call us or make callback request.
please call us or make callback request.
To learn more about Business Introducer and other trading related information,
please call us or make callback request.
please call us or make callback request.
For further information regarding potential cooperation,
please call us or make callback request.
please call us or make callback request.