Note: This section contains information in English only.
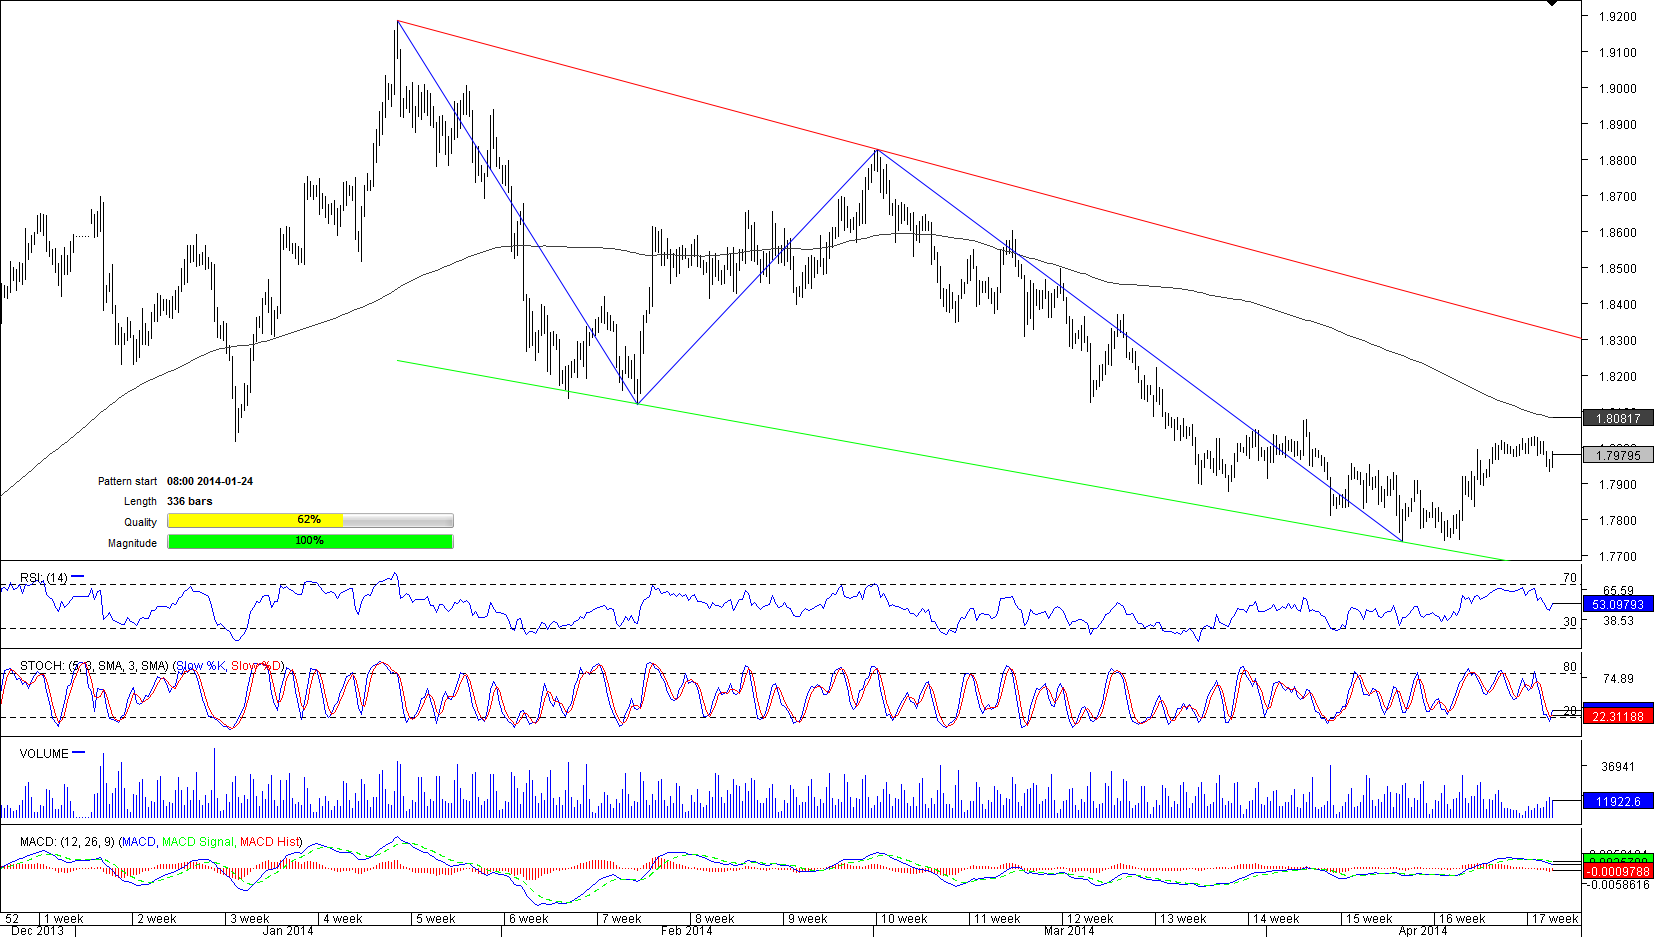
 After peaking at 1.9189 on January 24 the Pound began losing ground versus the Aussie. The trend has an explanation from the fundamental analysis, however, what is more important, is the fact, the pair has been moving perfectly within the Fibonacci retracement since March 12, 2013. Just 12 days ago bears made another attempt to penetrate the lower trend line, however, the price bounced back. A sharp increase is unexpected, even despite the fact 68% of traders are holding long positions. 23.14% Fibo and a 200-period SMA at 1.8077 are likely to stop pair's appreciation, and according to technicals on a daily and weekly chart, the pair will continue moving to the south.

Tue, 22 Apr 2014 12:25:16 GMT
Source: Dukascopy Bank SA
© Dukascopy Bank SA
© Dukascopy Bank SA
Actual Topics
Subscribe to "Fundamental Analysis" feed
Subscribe
Per scoprire di più sulla piattaforma di Dukascopy Bank per Forex/CFD, sul SWFX ed altre informazioni relative al trading,
la preghiamo di contattarci o richiedere di essere contattato (callback request)
la preghiamo di contattarci o richiedere di essere contattato (callback request)
For further information regarding potential cooperation,
please call us or make callback request.
please call us or make callback request.
To learn more about Dukascopy Bank Binary Options
/ Forex trading platform, SWFX and other trading related information,
please call us or make callback request.
please call us or make callback request.
Per scoprire di più sulla piattaforma di Dukascopy Bank per Forex/CFD, sul SWFX ed altre informazioni relative al trading,
la preghiamo di contattarci o richiedere di essere contattato (callback request).
la preghiamo di contattarci o richiedere di essere contattato (callback request).
To learn more about Crypto Trading / CFD / Forex trading platform, SWFX and other trading related information,
please call us or make callback request.
please call us or make callback request.
To learn more about Business Introducer and other trading related information,
please call us or make callback request.
please call us or make callback request.
For further information regarding potential cooperation,
please call us or make callback request.
please call us or make callback request.