Currently the pair is vacillating below the triangle support, albeit slightly, meaning that now it represents a lucrative opportunity for traders as a sharp depreciation is likely to take place before long. This is also bolstered by SWFX data, indicating that 64.52% of all orders are to sell the pair.
Note: This section contains information in English only.
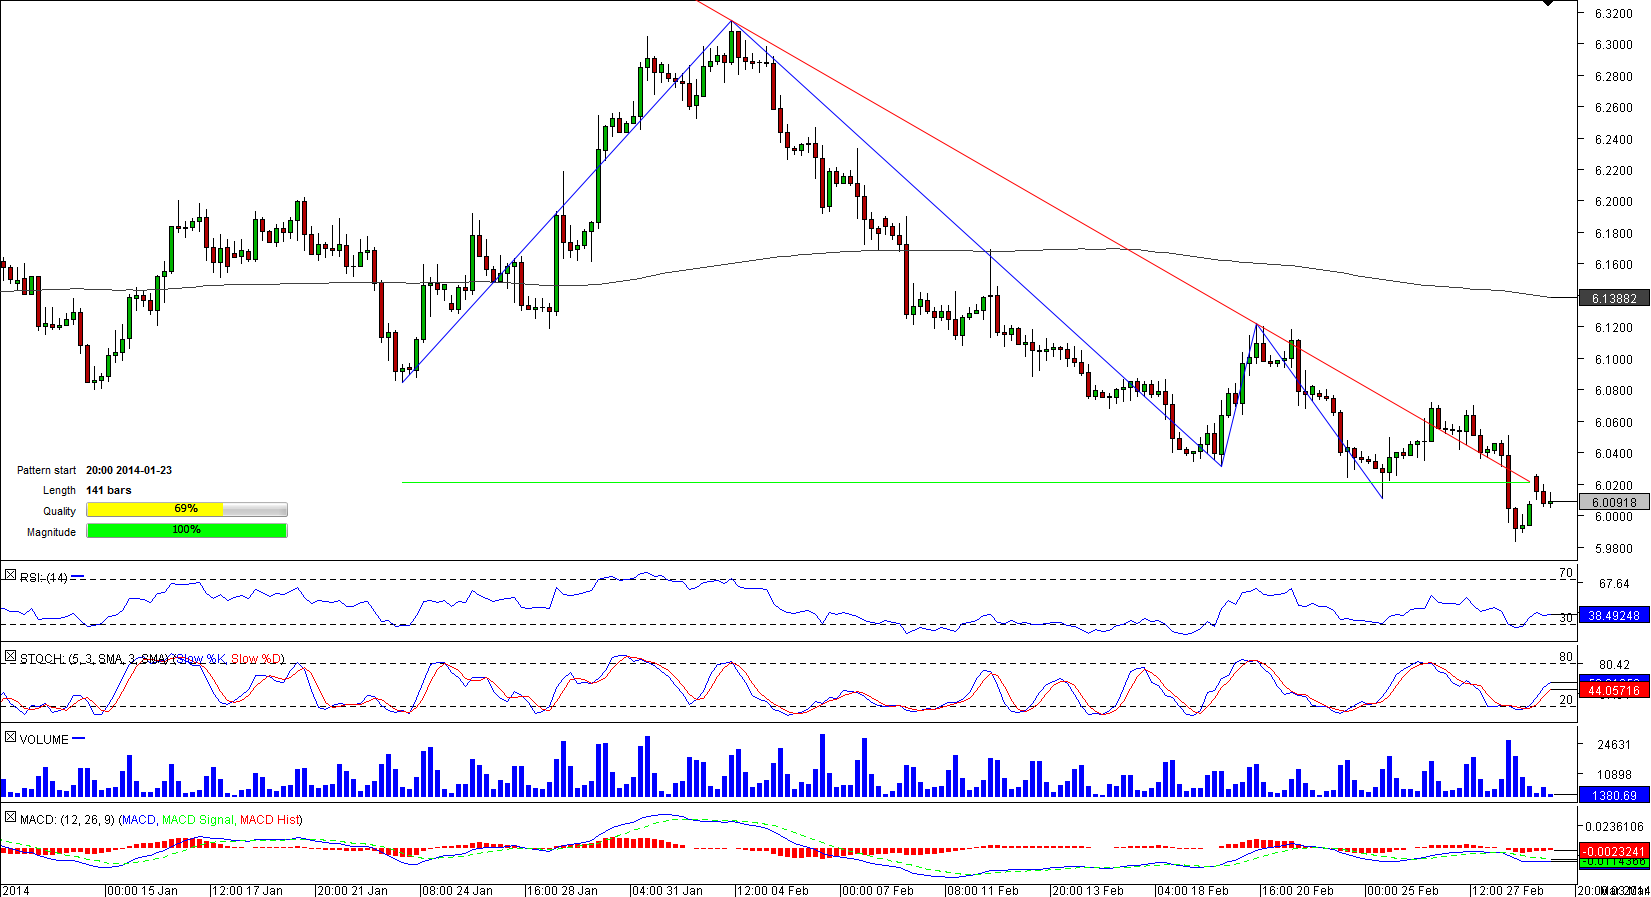
 The descending triangle pattern shaped by USD/NOK started on January 23, several days before the pair hit a four-year of 6.3134. Being a bearish formation, the channel was constantly pushing the pair lower to its support line at 6.0210 that was broken on February 28 when the pair approached the apex.
Currently the pair is vacillating below the triangle support, albeit slightly, meaning that now it represents a lucrative opportunity for traders as a sharp depreciation is likely to take place before long. This is also bolstered by SWFX data, indicating that 64.52% of all orders are to sell the pair.

Mon, 03 Mar 2014 08:52:09 GMT
Source: Dukascopy Bank SA
© Dukascopy Bank SA
Currently the pair is vacillating below the triangle support, albeit slightly, meaning that now it represents a lucrative opportunity for traders as a sharp depreciation is likely to take place before long. This is also bolstered by SWFX data, indicating that 64.52% of all orders are to sell the pair.
© Dukascopy Bank SA
Actual Topics
Subscribe to "Fundamental Analysis" feed
Subscribe
Per scoprire di più sulla piattaforma di Dukascopy Bank per Forex/CFD, sul SWFX ed altre informazioni relative al trading,
la preghiamo di contattarci o richiedere di essere contattato (callback request)
la preghiamo di contattarci o richiedere di essere contattato (callback request)
For further information regarding potential cooperation,
please call us or make callback request.
please call us or make callback request.
To learn more about Dukascopy Bank Binary Options
/ Forex trading platform, SWFX and other trading related information,
please call us or make callback request.
please call us or make callback request.
Per scoprire di più sulla piattaforma di Dukascopy Bank per Forex/CFD, sul SWFX ed altre informazioni relative al trading,
la preghiamo di contattarci o richiedere di essere contattato (callback request).
la preghiamo di contattarci o richiedere di essere contattato (callback request).
To learn more about Crypto Trading / CFD / Forex trading platform, SWFX and other trading related information,
please call us or make callback request.
please call us or make callback request.
To learn more about Business Introducer and other trading related information,
please call us or make callback request.
please call us or make callback request.
For further information regarding potential cooperation,
please call us or make callback request.
please call us or make callback request.