Note: This section contains information in English only.
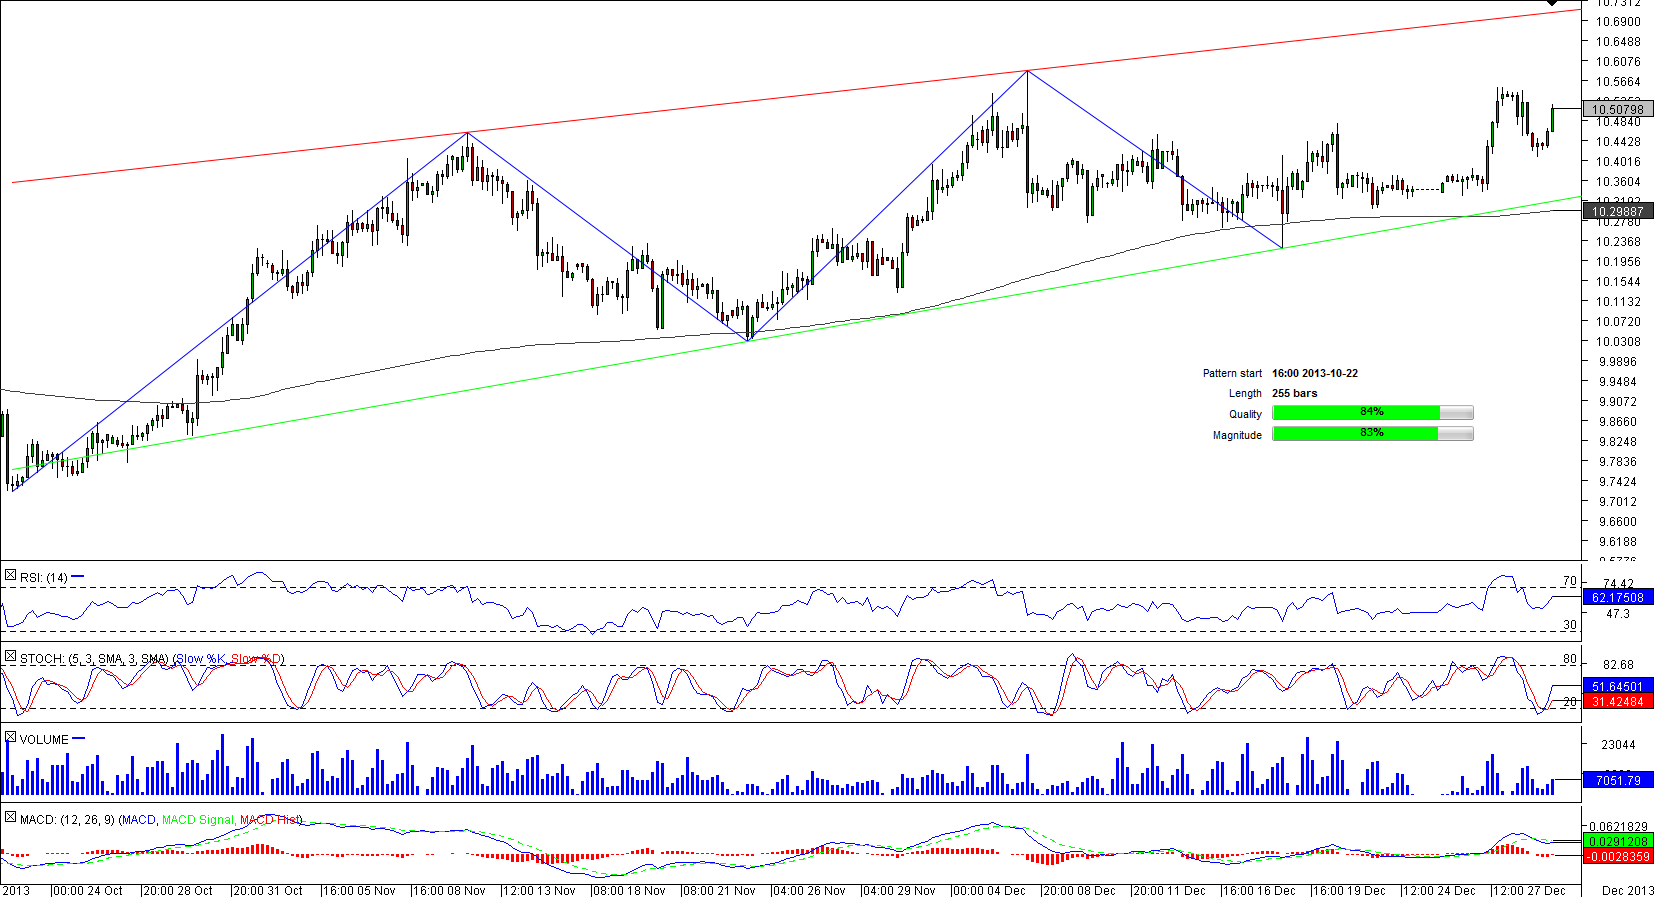
 While on the daily chart USD/ZAR is currently moving from the lower boundary of the bullish channel pattern towards the upper, on the four-hour time-frame the currency pair is forming a rising wedge. Being that this formation usually portends a reversal, we should be especially careful when the price bounces off the resistances at 10.71, where it is currently headed, and returns back to the rising support line at 10.2989. Even though this demand area is strengthened by the 200-period SMA and many of the technical indicators remain bullish, there are substantial downside risks. If they materialise, USD/ZAR will most likely fall down to 10.28, but the dip may also extend to 10.73, where the figure was started.

Tue, 31 Dec 2013 12:02:58 GMT
Source: Dukascopy Bank SA
© Dukascopy Bank SA
© Dukascopy Bank SA
Actual Topics
Subscribe to "Fundamental Analysis" feed
Subscribe
Per scoprire di più sulla piattaforma di Dukascopy Bank per Forex/CFD, sul SWFX ed altre informazioni relative al trading,
la preghiamo di contattarci o richiedere di essere contattato (callback request)
la preghiamo di contattarci o richiedere di essere contattato (callback request)
For further information regarding potential cooperation,
please call us or make callback request.
please call us or make callback request.
To learn more about Dukascopy Bank Binary Options
/ Forex trading platform, SWFX and other trading related information,
please call us or make callback request.
please call us or make callback request.
Per scoprire di più sulla piattaforma di Dukascopy Bank per Forex/CFD, sul SWFX ed altre informazioni relative al trading,
la preghiamo di contattarci o richiedere di essere contattato (callback request).
la preghiamo di contattarci o richiedere di essere contattato (callback request).
To learn more about Crypto Trading / CFD / Forex trading platform, SWFX and other trading related information,
please call us or make callback request.
please call us or make callback request.
To learn more about Business Introducer and other trading related information,
please call us or make callback request.
please call us or make callback request.
For further information regarding potential cooperation,
please call us or make callback request.
please call us or make callback request.