Note: This section contains information in English only.
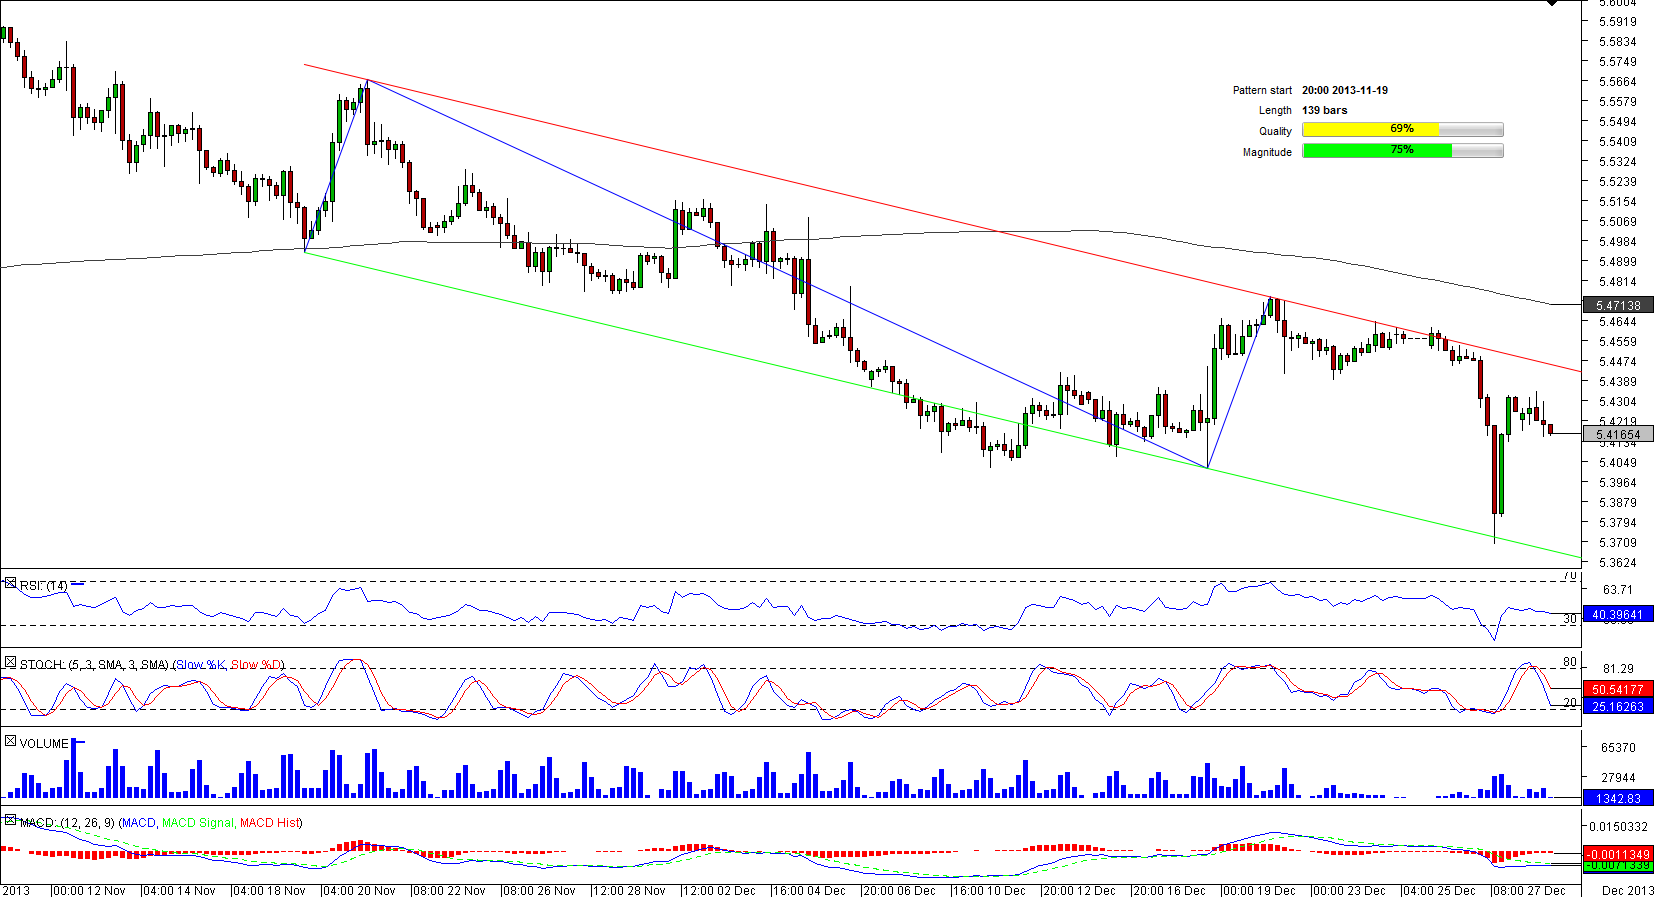
 Soon after peaking at 5.6111 USD/DKK came under strong selling pressure and fell beneath the 200-period SMA. Accordingly, there is a good chance the currency pair will descend from the current trading levels to at least the lower edge of the downward-sloping corridor at 5.3750. This course of events is also suggested by the technical indicators on the four-hour chart—four of them are bearish and only one is bullish. For this scenario to materialise, the upper falling trend-line, currently at 5.4450, should limit the rallies in the short run, though the negative with respect to USD/DKK bias will remain topical unless the resistance at 5.4694 (weekly R1 and 200-period SMA) is broken to the upside.

Mon, 30 Dec 2013 14:23:40 GMT
Source: Dukascopy Bank SA
© Dukascopy Bank SA
© Dukascopy Bank SA
Actual Topics
Subscribe to "Fundamental Analysis" feed
Subscribe
Per scoprire di più sulla piattaforma di Dukascopy Bank per Forex/CFD, sul SWFX ed altre informazioni relative al trading,
la preghiamo di contattarci o richiedere di essere contattato (callback request)
la preghiamo di contattarci o richiedere di essere contattato (callback request)
For further information regarding potential cooperation,
please call us or make callback request.
please call us or make callback request.
To learn more about Dukascopy Bank Binary Options
/ Forex trading platform, SWFX and other trading related information,
please call us or make callback request.
please call us or make callback request.
Per scoprire di più sulla piattaforma di Dukascopy Bank per Forex/CFD, sul SWFX ed altre informazioni relative al trading,
la preghiamo di contattarci o richiedere di essere contattato (callback request).
la preghiamo di contattarci o richiedere di essere contattato (callback request).
To learn more about Crypto Trading / CFD / Forex trading platform, SWFX and other trading related information,
please call us or make callback request.
please call us or make callback request.
To learn more about Business Introducer and other trading related information,
please call us or make callback request.
please call us or make callback request.
For further information regarding potential cooperation,
please call us or make callback request.
please call us or make callback request.