Note: This section contains information in English only.
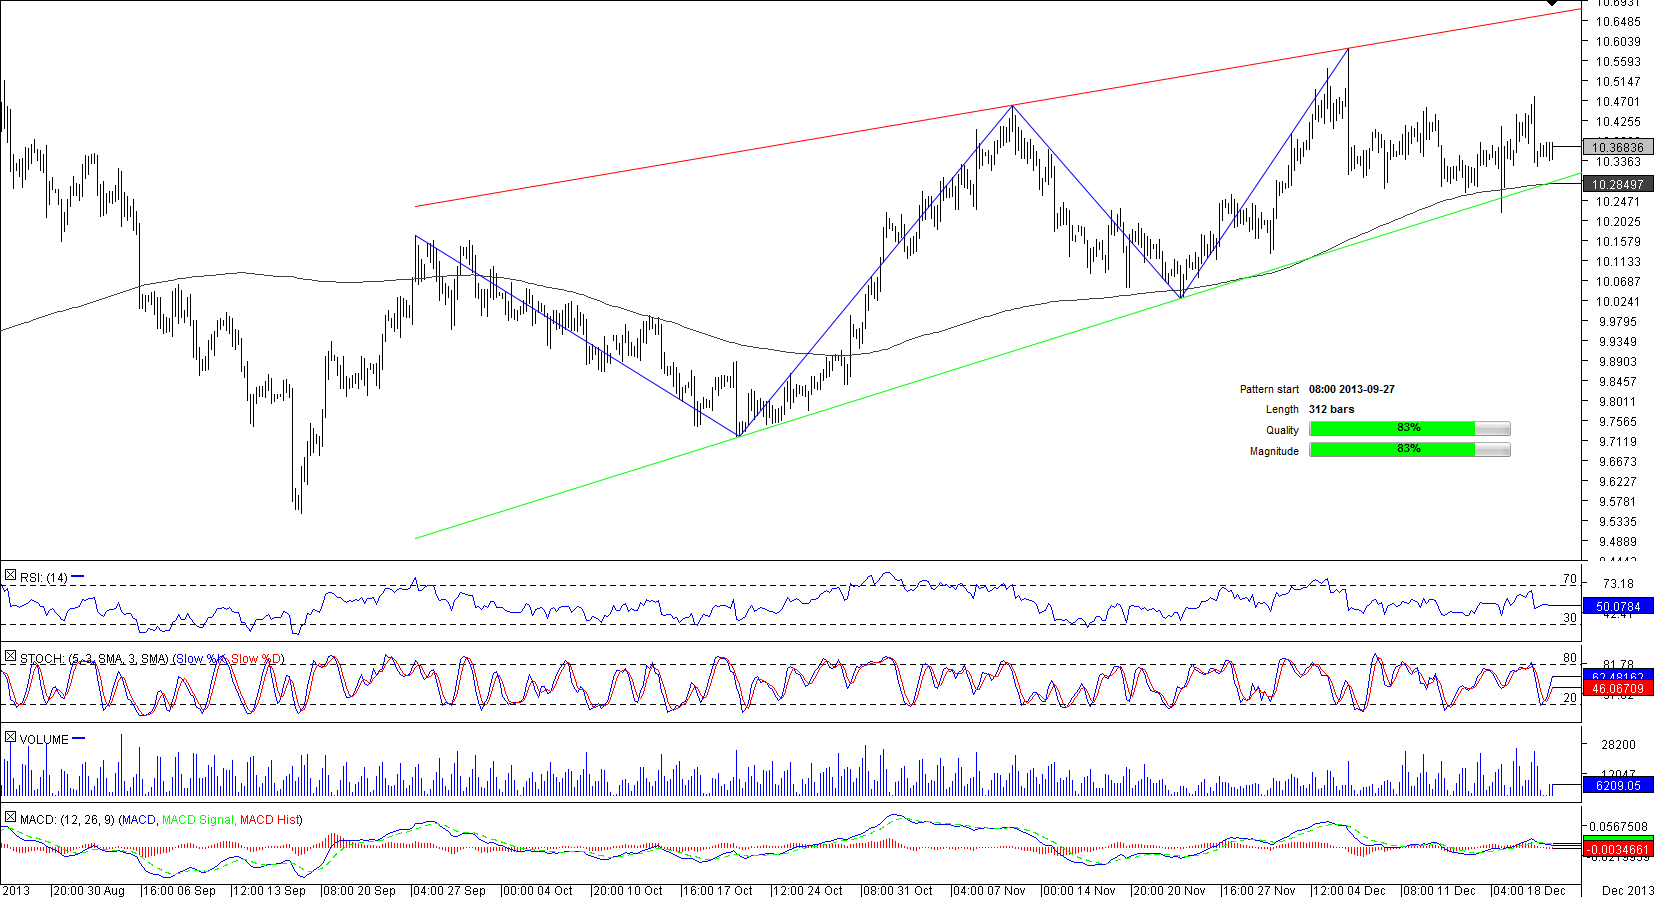
 The rising wedge pattern on the four-hour chart of USD/ZAR remains topical, especially considering that the latest rebound from the lower up-trend support line seems to have failed to extend to the upper boundary of the figure. Accordingly, the chance of a break-out to the downside is now particularly elevated, regardless of the 4H technical indicators that are mostly bullish at the moment.

Mon, 23 Dec 2013 11:54:17 GMT
Source: Dukascopy Bank SA
© Dukascopy Bank SA
If the key demand zone around 10.2980 is violated, the first target for the decline is likely to be the most recent trough near 10.0995. In case the sell-off persists, 9.7447 and 9.5549 will become the next two most probable destinations for USD/ZAR.
© Dukascopy Bank SA
Actual Topics
Subscribe to "Fundamental Analysis" feed
Subscribe
Per scoprire di più sulla piattaforma di Dukascopy Bank per Forex/CFD, sul SWFX ed altre informazioni relative al trading,
la preghiamo di contattarci o richiedere di essere contattato (callback request)
la preghiamo di contattarci o richiedere di essere contattato (callback request)
For further information regarding potential cooperation,
please call us or make callback request.
please call us or make callback request.
To learn more about Dukascopy Bank Binary Options
/ Forex trading platform, SWFX and other trading related information,
please call us or make callback request.
please call us or make callback request.
Per scoprire di più sulla piattaforma di Dukascopy Bank per Forex/CFD, sul SWFX ed altre informazioni relative al trading,
la preghiamo di contattarci o richiedere di essere contattato (callback request).
la preghiamo di contattarci o richiedere di essere contattato (callback request).
To learn more about Crypto Trading / CFD / Forex trading platform, SWFX and other trading related information,
please call us or make callback request.
please call us or make callback request.
To learn more about Business Introducer and other trading related information,
please call us or make callback request.
please call us or make callback request.
For further information regarding potential cooperation,
please call us or make callback request.
please call us or make callback request.