Note: This section contains information in English only.
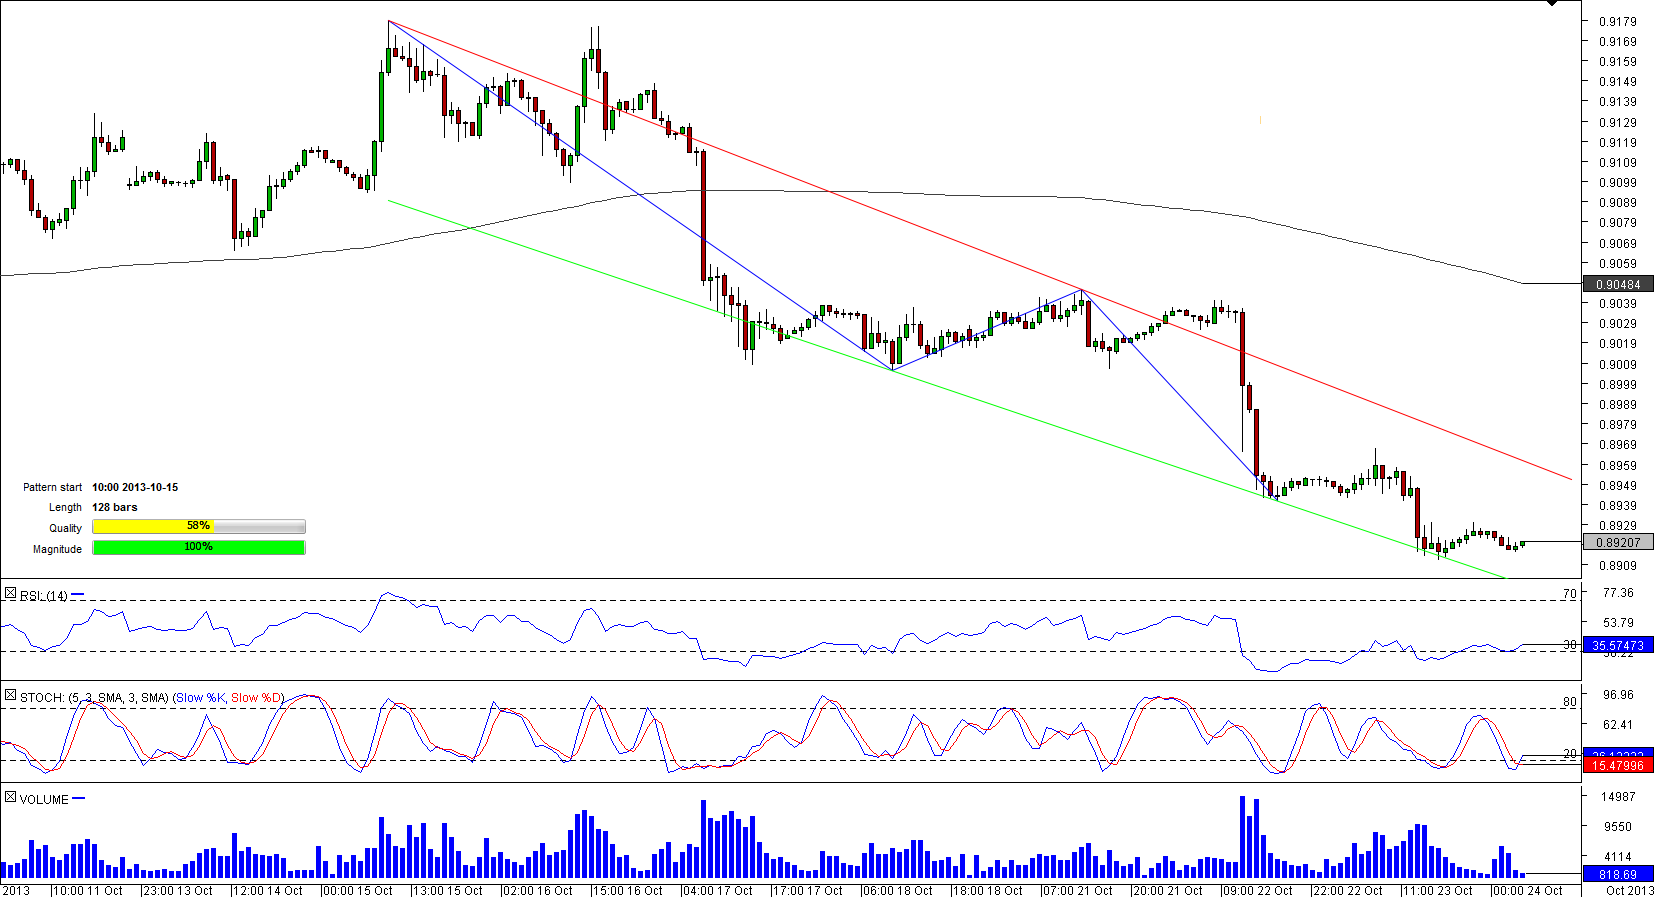
 On October 15, USD/CHF started its sharp depreciation, being trapped between two downward sloping lines. The pair plummeted to the lowest level since November 2011 several hours ago and now remains close to this level. In case the currency couple continues to succumb to heavy selling pressure it may re-approach the lower boundary of the pattern and may even try to breach it. A fall below this important support level would suggest on-going weakness of the pair and may take it well below the recent low. Technical indicators also point to a possible decline in the short-term but are neutral for medium and long terms.

Thu, 24 Oct 2013 06:05:16 GMT
Source: Dukascopy Bank SA
© Dukascopy Bank SA
© Dukascopy Bank SA
Actual Topics
Subscribe to "Fundamental Analysis" feed
Subscribe
Per scoprire di più sulla piattaforma di Dukascopy Bank per Forex/CFD, sul SWFX ed altre informazioni relative al trading,
la preghiamo di contattarci o richiedere di essere contattato (callback request)
la preghiamo di contattarci o richiedere di essere contattato (callback request)
For further information regarding potential cooperation,
please call us or make callback request.
please call us or make callback request.
To learn more about Dukascopy Bank Binary Options
/ Forex trading platform, SWFX and other trading related information,
please call us or make callback request.
please call us or make callback request.
Per scoprire di più sulla piattaforma di Dukascopy Bank per Forex/CFD, sul SWFX ed altre informazioni relative al trading,
la preghiamo di contattarci o richiedere di essere contattato (callback request).
la preghiamo di contattarci o richiedere di essere contattato (callback request).
To learn more about Crypto Trading / CFD / Forex trading platform, SWFX and other trading related information,
please call us or make callback request.
please call us or make callback request.
To learn more about Business Introducer and other trading related information,
please call us or make callback request.
please call us or make callback request.
For further information regarding potential cooperation,
please call us or make callback request.
please call us or make callback request.