Note: This section contains information in English only.
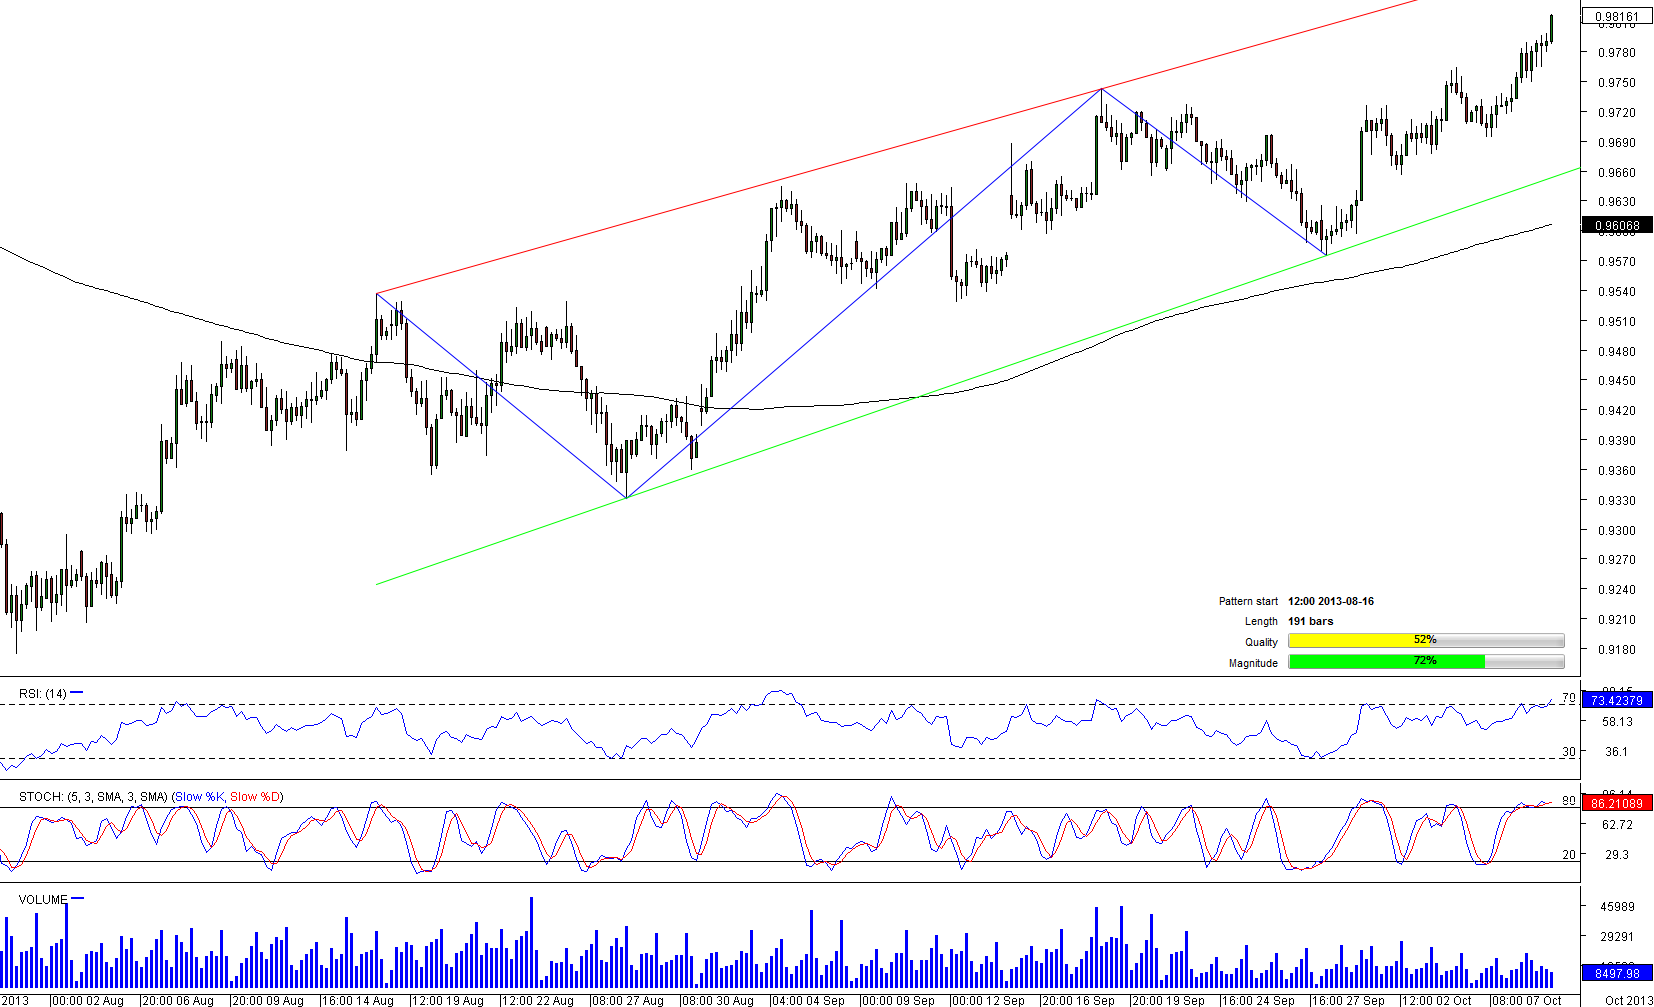
 During the last 191 bars AUD/CAD has been moving in channel up boundaries, which was formed on August 16. Overvalued Aussie has been a major concern for the RBA and even though analysts do not see another rate cut, Oz currency looks overbought already and a period of consolidation is needed. This idea is supported by weekly technical indicators, which are sending "sell" signals. As the outlook is bearish, short traders could focus on 0.9694/88 represented by daily support, weekly pivot and Bollinger band, suggesting in case this level is breached, the pair will move towards pattern's support, which is 35 pips lower.

Wed, 09 Oct 2013 13:56:13 GMT
Source: Dukascopy Bank SA
© Dukascopy Bank SA
© Dukascopy Bank SA
Actual Topics
Subscribe to "Fundamental Analysis" feed
Subscribe
Per scoprire di più sulla piattaforma di Dukascopy Bank per Forex/CFD, sul SWFX ed altre informazioni relative al trading,
la preghiamo di contattarci o richiedere di essere contattato (callback request)
la preghiamo di contattarci o richiedere di essere contattato (callback request)
For further information regarding potential cooperation,
please call us or make callback request.
please call us or make callback request.
To learn more about Dukascopy Bank Binary Options
/ Forex trading platform, SWFX and other trading related information,
please call us or make callback request.
please call us or make callback request.
Per scoprire di più sulla piattaforma di Dukascopy Bank per Forex/CFD, sul SWFX ed altre informazioni relative al trading,
la preghiamo di contattarci o richiedere di essere contattato (callback request).
la preghiamo di contattarci o richiedere di essere contattato (callback request).
To learn more about Crypto Trading / CFD / Forex trading platform, SWFX and other trading related information,
please call us or make callback request.
please call us or make callback request.
To learn more about Business Introducer and other trading related information,
please call us or make callback request.
please call us or make callback request.
For further information regarding potential cooperation,
please call us or make callback request.
please call us or make callback request.