Note: This section contains information in English only.


Mon, 02 Sep 2013 07:11:19 GMT
Source: Dukascopy Bank SA
© Dukascopy Bank SA
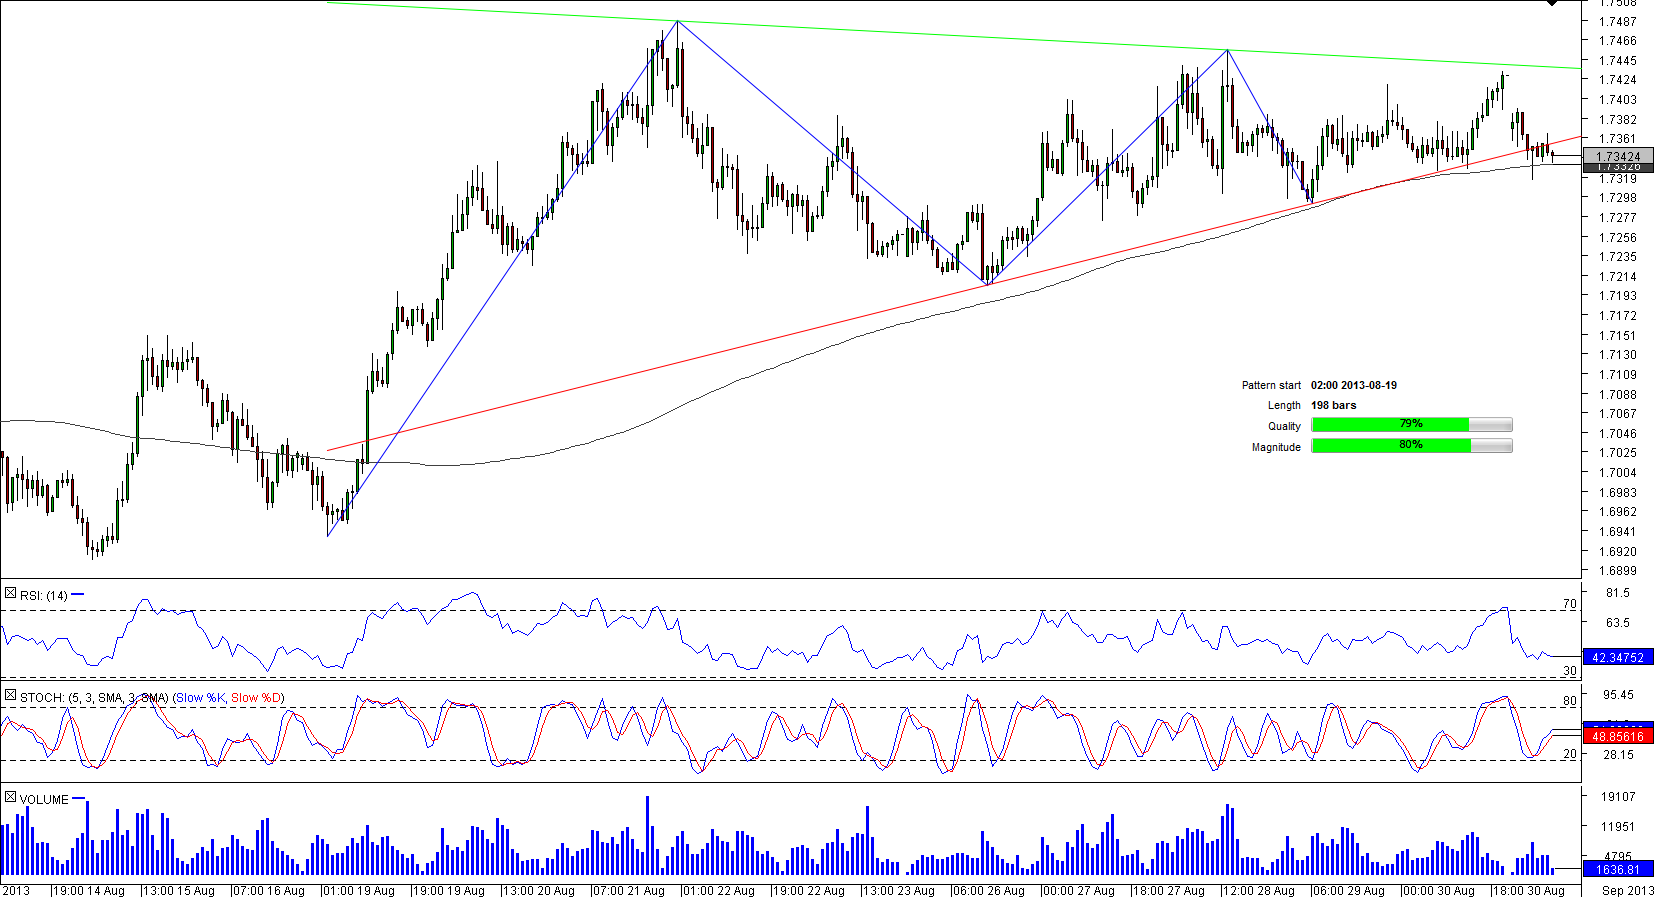
Following a strong surge of the Sterling against the Australian Dollar in the early stage of the pattern, the price has been gradually reducing its trading range, resulting in appearance of the triangle on an hourly chart.
However, just a few bars ago GBP/AUD fell through the rising support line down to the 200-hour SMA, meaning that the bias towards the pair turned negative and the long-term moving average may not be able prevent a deeper decline, either to the daily S2 at 1.7289 or even to the daily S3 at 1.7252. While near-term studies are in favour of such a scenario, signals on a daily time-frame are largely the ‘buy' ones.
© Dukascopy Bank SA
Actual Topics
Subscribe to "Fundamental Analysis" feed
Subscribe
Per scoprire di più sulla piattaforma di Dukascopy Bank per Forex/CFD, sul SWFX ed altre informazioni relative al trading,
la preghiamo di contattarci o richiedere di essere contattato (callback request)
la preghiamo di contattarci o richiedere di essere contattato (callback request)
For further information regarding potential cooperation,
please call us or make callback request.
please call us or make callback request.
To learn more about Dukascopy Bank Binary Options
/ Forex trading platform, SWFX and other trading related information,
please call us or make callback request.
please call us or make callback request.
Per scoprire di più sulla piattaforma di Dukascopy Bank per Forex/CFD, sul SWFX ed altre informazioni relative al trading,
la preghiamo di contattarci o richiedere di essere contattato (callback request).
la preghiamo di contattarci o richiedere di essere contattato (callback request).
To learn more about Crypto Trading / CFD / Forex trading platform, SWFX and other trading related information,
please call us or make callback request.
please call us or make callback request.
To learn more about Business Introducer and other trading related information,
please call us or make callback request.
please call us or make callback request.
For further information regarding potential cooperation,
please call us or make callback request.
please call us or make callback request.