Note: This section contains information in English only.
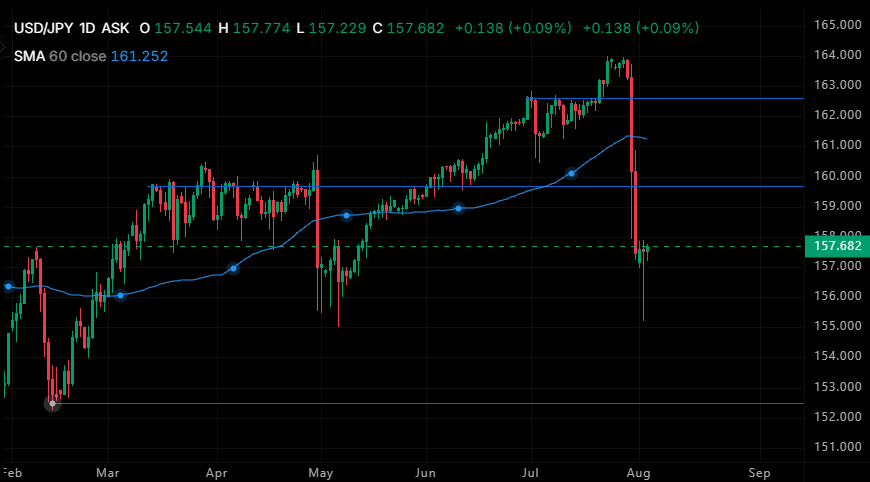
The USD/JPY daily chart shows a major structural shift as price violently broke down from its multi-month uptrend peak above 164.00, crashing straight through the 60-period Simple Moving Average (161.25) to tap a low near 155.20 before consolidating around 157.68. With price now trading well below the 60-SMA, the previous dynamic support area around 159.60–161.25 converts into strong overhead resistance; a failed relief rally into this zone would favor a bearish continuation back down toward the 155.20 wick low and major structural floor at 152.60, whereas buyers would need to decisively reclaim 161.25 to neutralize the aggressive downside momentum.
Tue, 04 Aug 2026 07:15:05 GMT
Source: Dukascopy Bank SA
Actual Topics
Per scoprire di più sulla piattaforma di Dukascopy Bank per Forex/CFD, sul SWFX ed altre informazioni relative al trading,
la preghiamo di contattarci o richiedere di essere contattato (callback request)
la preghiamo di contattarci o richiedere di essere contattato (callback request)
For further information regarding potential cooperation,
please call us or make callback request.
please call us or make callback request.
To learn more about Dukascopy Bank Binary Options
/ Forex trading platform, SWFX and other trading related information,
please call us or make callback request.
please call us or make callback request.
Per scoprire di più sulla piattaforma di Dukascopy Bank per Forex/CFD, sul SWFX ed altre informazioni relative al trading,
la preghiamo di contattarci o richiedere di essere contattato (callback request).
la preghiamo di contattarci o richiedere di essere contattato (callback request).
To learn more about Crypto Trading / CFD / Forex trading platform, SWFX and other trading related information,
please call us or make callback request.
please call us or make callback request.
To learn more about Business Introducer and other trading related information,
please call us or make callback request.
please call us or make callback request.
For further information regarding potential cooperation,
please call us or make callback request.
please call us or make callback request.