Open trading account
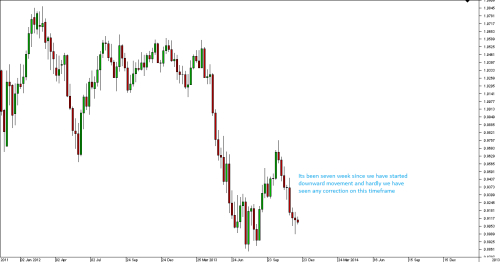
Aussie dollar has seen a downward movement of almost 800 pips since last seven weeks as can be found in the weekly chart below. Now, from the price action trader's point of view, it is due for correction. Let us see how do I interpret the interpretation based on weekly, daily and monthly charts respectively.
AUD/USD weekly chart
AUD/USD daily chart : As we can observe, last Thursday was an inside day and on Friday, initially the price breaks the low of the inside bar and then comes back strongly and closes well above the top of the inside bar which is also known as an outside bar. It is a failed breakout pattern as well. This is a strong indication of a price reversal and a possible correction. Now the price zone of 50% fib retracement as well as a strong S/R zone is sitting between 9250 to 9300 which is our target area.
AUD/USD monthly chart : On monthly, as we can see , the same S/R zone of 9250 to 9300 is a strong confluence area with multiple factors. The bottom of the version of pin bar and its bottom make this area more stronger.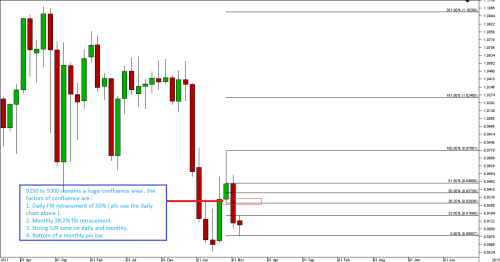
AUD/USD weekly chart

AUD/USD daily chart : As we can observe, last Thursday was an inside day and on Friday, initially the price breaks the low of the inside bar and then comes back strongly and closes well above the top of the inside bar which is also known as an outside bar. It is a failed breakout pattern as well. This is a strong indication of a price reversal and a possible correction. Now the price zone of 50% fib retracement as well as a strong S/R zone is sitting between 9250 to 9300 which is our target area.

AUD/USD monthly chart : On monthly, as we can see , the same S/R zone of 9250 to 9300 is a strong confluence area with multiple factors. The bottom of the version of pin bar and its bottom make this area more stronger.