Open trading account
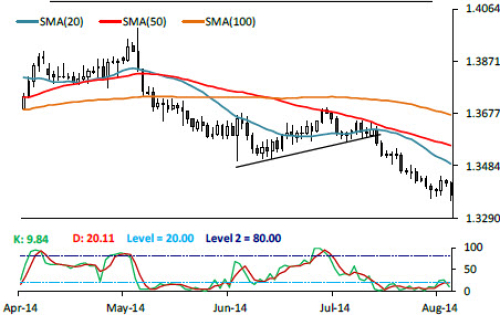
Weak below 1.3380/75
The EURUSD pair was unable to hold onto its gains after a strong surge on Friday, resuming its downtrend. In the previous session, the pair ended at 1.3376 after hitting 1.3357 (the lowest level in nine months). The main trend on the daily chart is currently down with an immediate support situated at 1.3366/65. If the pair breaks below this level on a daily closing basis, further selling pressure could be witnessed with a possibility of targeting 1.3320/18 and 1.3300 levels. On the weekly chart, the pair is trading below its 200week SMA, with the RSI pointing lower below its 40 line exerting a bearish influence on the pair. Immediate intraday resistance resides in the 1.3396-1.3405 zone, followed by 1.3418/20 and 1.3444/50 levels. Formation of positive divergence condition on the 8H chart along with oversold hourly stochastics is hinting at mild recovery over intraday basis.
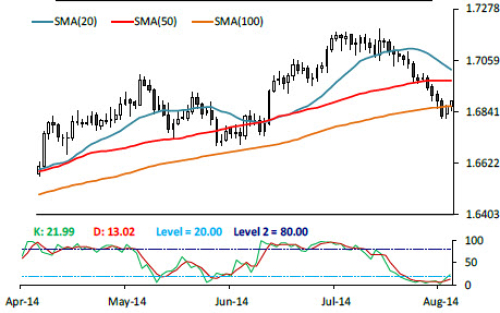
Intraday bias- positive above 1.6857/60
The GBPUSD pair initially moved lower yesterday however recovered quickly to end the session above its 100day SMA at 1.6886. Formation of a piercing candlestick pattern on Monday on the daily chart along with stochastics crossover in oversold zone is hinting at cautious recovery in the coming sessions. As of now, the 1.6867/65 level is acting as a key support, continued trading above which over intraday basis is likely to push the pair higher to retest the 1.6890/1.6900 zone. A strong surge above 1.6900 would trigger further strength with next potential upside targets at 1.6918/20 and 1.6935 levels. Hourly price action is suggesting at mild correction, however as long as the support at the 1.6860/57 is holding well, bias remains to the upside. Breach below this will pave the way for a move lower towards 1.6822/18.
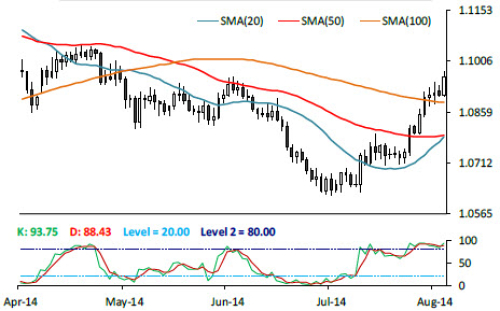
Positive as long as above 1.0961/62
After trading sideways for the past three sessions, the USDCAD pair saw a strong surge in the previous session, forming a long bullish candlestick on the daily chart and making high at 1.0978 (last tested in early May). Despite the strong rally yesterday, overextended trading of the daily stochastics in the overbought region is hinting at exhaustion of the current uptrend. Also, with the daily RSI placed in its overbought territory, the formation of a temporary top might be in place soon. On the 2H and 4H chart, the pair is trading flat along with its momentum indicators also trading horizontal indicating a neutral technical picture over intraday basis. Stability above the 1.0961/62 level might negate any weakness in the near term. Key supports to be watched resides in the 1.0932/25 zone, followed by an important one at 1.0900/1.0890.
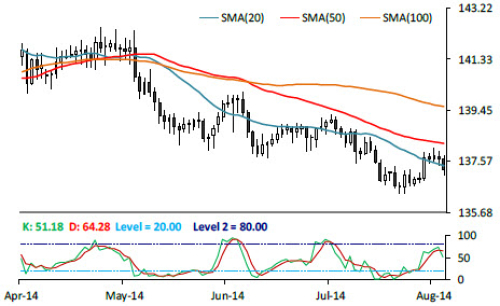
Weak below 137.00
After trading sideways within a narrow range for the past few sessions, the EURJPY pair had a bearish showing yesterday, making a low at 137.07 and ending at 137.24. Hourly price action is hinting at mild recovery over intraday basis. However, we will watch out for the 4H and 8H momentum indicators which continue to reflect decelerating momentum. As of now, the psychological support at 137.00 is holding well, a breach below which might target the next support situated in the 136.75-136.60/58 zone. Further weakness might pave the way for 136.40/37 (which is likely to be supportive). On the upside key resistance resides at 137.23/25, a break and stability above which would turn intraday bias to positive.
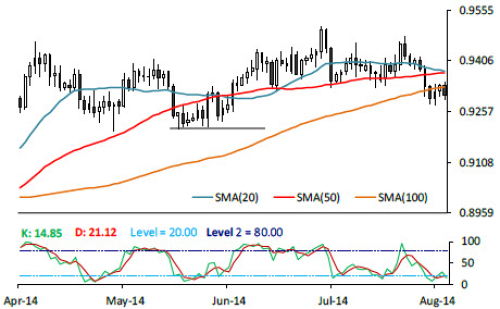
Strong resistance remains at 0.9340/44
The AUDUSD pair initially tried to rise, however faced strong resistance at the earlier mentioned level of 0.9344, ending the session on a bearish note at 0.9305. Formation of a bearish engulfing candlestick pattern on the daily chart indicates weakness. The pair is currently testing the key support at 0.9292/86, a breach below which on a daily closing basis would trigger further acceleration to the downside. However, rising upside momentum on the hourly charts suggests a possible recovery over intraday basis. Immediate upside target resides at around 0.9310/12, followed by an important one in the 0.9336- 0.9345 zone. A surge above the latter would turn the near term bias to upside.
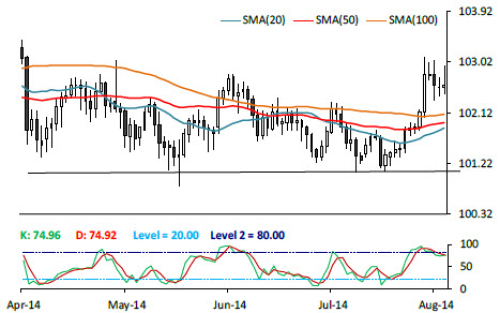
Range trading 102.25-103.05/06
The USDJPY had a volatile session yesterday, where it initially rallied to make a high at 102.94, before retreating slightly to form a shooting star candlestick pattern on the daily chart and end at 102.60. The 2H chart shows price around a flat 20 SMA and indicators also horizontal around their midlines, giving no clear signs of short term direction. Meanwhile, in the 4H chart the technical outlook is also neutral, with the extremes of the latest range at 102.25 and 103.05/06. Some momentum outside this range may set some intraday direction for the pair.
Strong resistance remains at $1296/98
The commodity started the session trading higher yesterday, however was unable to hold onto its gains, retreating slightly to end the session at $1284.00, forming a shooting star candlestick pattern on the daily chart. As of now, momentum indicators on the hourly and 2H charts are hinting at rise in upside momentum suggesting a possible upside over intraday basis. Key resistance remains intact at the earlier mentioned $1296/98 level. Only a strong surge and stability above this level would turn the near term bias to bullish. Key support remains intact at $1282/80, followed by $1272/70 and $1260 levels.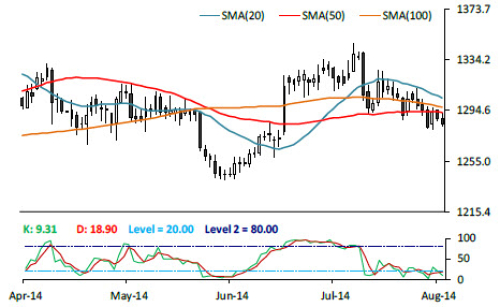
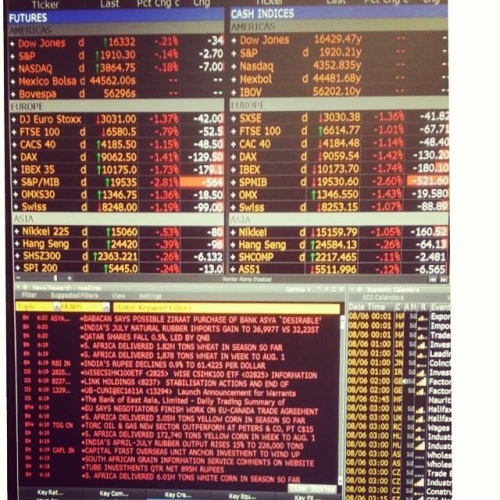
And On The Other SideNothing Green Today
The EURUSD pair was unable to hold onto its gains after a strong surge on Friday, resuming its downtrend. In the previous session, the pair ended at 1.3376 after hitting 1.3357 (the lowest level in nine months). The main trend on the daily chart is currently down with an immediate support situated at 1.3366/65. If the pair breaks below this level on a daily closing basis, further selling pressure could be witnessed with a possibility of targeting 1.3320/18 and 1.3300 levels. On the weekly chart, the pair is trading below its 200week SMA, with the RSI pointing lower below its 40 line exerting a bearish influence on the pair. Immediate intraday resistance resides in the 1.3396-1.3405 zone, followed by 1.3418/20 and 1.3444/50 levels. Formation of positive divergence condition on the 8H chart along with oversold hourly stochastics is hinting at mild recovery over intraday basis.

Intraday bias- positive above 1.6857/60
The GBPUSD pair initially moved lower yesterday however recovered quickly to end the session above its 100day SMA at 1.6886. Formation of a piercing candlestick pattern on Monday on the daily chart along with stochastics crossover in oversold zone is hinting at cautious recovery in the coming sessions. As of now, the 1.6867/65 level is acting as a key support, continued trading above which over intraday basis is likely to push the pair higher to retest the 1.6890/1.6900 zone. A strong surge above 1.6900 would trigger further strength with next potential upside targets at 1.6918/20 and 1.6935 levels. Hourly price action is suggesting at mild correction, however as long as the support at the 1.6860/57 is holding well, bias remains to the upside. Breach below this will pave the way for a move lower towards 1.6822/18.

Positive as long as above 1.0961/62
After trading sideways for the past three sessions, the USDCAD pair saw a strong surge in the previous session, forming a long bullish candlestick on the daily chart and making high at 1.0978 (last tested in early May). Despite the strong rally yesterday, overextended trading of the daily stochastics in the overbought region is hinting at exhaustion of the current uptrend. Also, with the daily RSI placed in its overbought territory, the formation of a temporary top might be in place soon. On the 2H and 4H chart, the pair is trading flat along with its momentum indicators also trading horizontal indicating a neutral technical picture over intraday basis. Stability above the 1.0961/62 level might negate any weakness in the near term. Key supports to be watched resides in the 1.0932/25 zone, followed by an important one at 1.0900/1.0890.

Weak below 137.00
After trading sideways within a narrow range for the past few sessions, the EURJPY pair had a bearish showing yesterday, making a low at 137.07 and ending at 137.24. Hourly price action is hinting at mild recovery over intraday basis. However, we will watch out for the 4H and 8H momentum indicators which continue to reflect decelerating momentum. As of now, the psychological support at 137.00 is holding well, a breach below which might target the next support situated in the 136.75-136.60/58 zone. Further weakness might pave the way for 136.40/37 (which is likely to be supportive). On the upside key resistance resides at 137.23/25, a break and stability above which would turn intraday bias to positive.

Strong resistance remains at 0.9340/44
The AUDUSD pair initially tried to rise, however faced strong resistance at the earlier mentioned level of 0.9344, ending the session on a bearish note at 0.9305. Formation of a bearish engulfing candlestick pattern on the daily chart indicates weakness. The pair is currently testing the key support at 0.9292/86, a breach below which on a daily closing basis would trigger further acceleration to the downside. However, rising upside momentum on the hourly charts suggests a possible recovery over intraday basis. Immediate upside target resides at around 0.9310/12, followed by an important one in the 0.9336- 0.9345 zone. A surge above the latter would turn the near term bias to upside.

Range trading 102.25-103.05/06
The USDJPY had a volatile session yesterday, where it initially rallied to make a high at 102.94, before retreating slightly to form a shooting star candlestick pattern on the daily chart and end at 102.60. The 2H chart shows price around a flat 20 SMA and indicators also horizontal around their midlines, giving no clear signs of short term direction. Meanwhile, in the 4H chart the technical outlook is also neutral, with the extremes of the latest range at 102.25 and 103.05/06. Some momentum outside this range may set some intraday direction for the pair.

Strong resistance remains at $1296/98
The commodity started the session trading higher yesterday, however was unable to hold onto its gains, retreating slightly to end the session at $1284.00, forming a shooting star candlestick pattern on the daily chart. As of now, momentum indicators on the hourly and 2H charts are hinting at rise in upside momentum suggesting a possible upside over intraday basis. Key resistance remains intact at the earlier mentioned $1296/98 level. Only a strong surge and stability above this level would turn the near term bias to bullish. Key support remains intact at $1282/80, followed by $1272/70 and $1260 levels.

And On The Other SideNothing Green Today