Open trading account
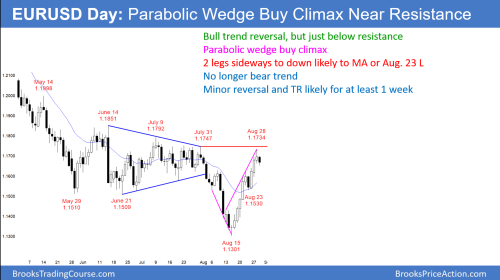
Yesterdays reversal was a 3rd leg up from the August 15 low. The 3 week rally was in a tight bull channel and therefore it is a parabolic wedge.
The EURUSD daily Forex chart had a 3 legged rally a tight bull channel. This is a parabolic wedge buy climax. Two small legs sideways to down over the next week are likely.
The rally came from a parabolic wedge sell clilmax. Trend reveersals usually have a transition when there are element of both a bull and bear trend. For example, the 1st leg up in the August 15 parabolic wedge bottom began before the final low. This is common.
The rally strong enough to have one more leg up before there is exhaustion. But it has met the minimum goal. In addition, it is just below the July 31 major lower high and at the 20 week EMA resistance. Furthermore, the daily charts has been oscillating around 1.17 for 4 months, so that is also resistance.
The daily chart has probably entered a trading range, especially it is back in the middle of a 4 month range. While there might be another minor high this week, the chart will probably be sideways for at least a week or two. Traders will sell rallies, buy selloffs, and take quik profit.
Overnight EURUSD Forex trading
The EURUSD 5 minute Forex chart sold off 70 pips overnight. I said before that the trading range would prbably be about 150 pips tall. Obvious support is the 20 day EMA, the August 23 low just above 1.15, and June 21 low.
When the daily chart enters a trading range, the lower time frame charts begin to have smaller bars and lots of small trading ranges. Day Traders will be quick to take profits.
However, there will be 30 - 50 pip per day trades from minor support and resistance on the daily and 60 minute charts.