Open trading account
Basic Elements of Gann Theory
Gann angles are a popular analysis and trading tool that are used to measure key elements, such as pattern, price and time. The often-debated topic of discussion among technical analysts is that the past, the present and the future all exist at the same time on a Gann angle. When analyzing or trading the course of a particular market, the trader tries to get an idea of where the market has been, where it is in relation to that former bottom or top, and how to use the information to forecast future price action.
Gann Angles Versus Trendlines
Of all of W.D. Gann's trading techniques available, drawing angles to trade and forecast is probably the most popular analysis tool used by traders. These angles are often compared to trendlines, but many people are unaware that they are not the same thing.
A Gann angle is a diagonal line that moves at a uniform rate of speed. A trendline is created by connecting bottoms to bottoms in the case of an uptrend and tops to tops in the case of a downtrend. The benefit of drawing a Gann angle compared to a trendline is that it moves at a uniform rate of speed. This allows the analyst to forecast where the price is going to be on a particular date in the future. This is not to say that a Gann angle always predicts where the market will be, but the analyst will know where the Gann angle will be, which will help gauge the strength and direction of the trend. A trendline, on the other hand, does have some predictive value, but because of the constant adjustments that usually take place, it's unreliable for making long-term forecasts.
Past, Present and Future
As mentioned earlier, the key concept to grasp when working with Gann angles is that the past, the present and the future all exist at the same time on the angles. This being said, the Gann angle can be used to forecast support and resistance, strength of direction and the timing of tops and bottoms.
Computing Gann Angles and LinesBasic Elements of Gann Theory
Gann angles are a popular analysis and trading tool that are used to measure key elements, such as pattern, price and time. The often-debated topic of discussion among technical analysts is that the past, the present and the future all exist at the same time on a Gann angle. When analyzing or trading the course of a particular market, the trader tries to get an idea of where the market has been, where it is in relation to that former bottom or top, and how to use the information to forecast future price action.
Gann Angles Versus Trendlines
Of all of W.D. Gann's trading techniques available, drawing angles to trade and forecast is probably the most popular analysis tool used by traders. These angles are often compared to trendlines, but many people are unaware that they are not the same thing.
A Gann angle is a diagonal line that moves at a uniform rate of speed. A trendline is created by connecting bottoms to bottoms in the case of an uptrend and tops to tops in the case of a downtrend. The benefit of drawing a Gann angle compared to a trendline is that it moves at a uniform rate of speed. This allows the analyst to forecast where the price is going to be on a particular date in the future. This is not to say that a Gann angle always predicts where the market will be, but the analyst will know where the Gann angle will be, which will help gauge the strength and direction of the trend. A trendline, on the other hand, does have some predictive value, but because of the constant adjustments that usually take place, it's unreliable for making long-term forecasts.
Past, Present and Future
As mentioned earlier, the key concept to grasp when working with Gann angles is that the past, the present and the future all exist at the same time on the angles. This being said, the Gann angle can be used to forecast support and resistance, strength of direction and the timing of tops and bottoms.
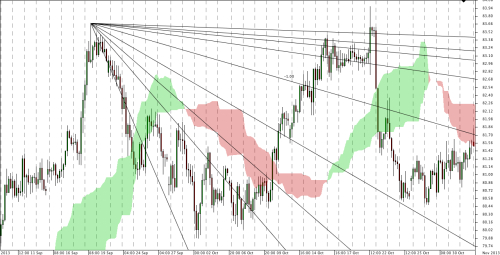
In technical analysis, a fan of lines drawn at the various Gann angles on a chart between notable peaks and troughs is often called a Gann fan. A Gann fan’s component lines always radiate toward the future, and they slope upwards in a rising market and downwards in a falling market.
Each line in a Gann fan is drawn by beginning at a common point that begins a market move, and then radiating from it at one of the nine significant angles identified by Gann. Specifically, the Gann angles are computed and drawn as follows:
1 x 8 - Drawn at 82.5 degrees
1 x 4 - Drawn at 75 degrees
1 x 3 - Drawn at 71.25 degrees
1 x 2 - Drawn at 63.75 degrees
1 x 1 - Drawn at 45 degrees
2 x 1 - Drawn at 26.25 degrees
3 x 1 - Drawn at 18.75 degrees
4 x 1 - Drawn at 15 degrees
8 x 1 - Drawn at 7.5 degrees
Rule of all Angles: When the market breaks an Angle, it will rotate to the next one.These lines can be drawn on the JFOREX PLATFORM's chart by clicking on Retracements on the toolbar.
Gann Angles as Theoretical Support and Resistance in Trending Markets
Theoretically, each of the nine Gann angles might offer resistance or lend support to prices in a trending situation. Furthermore, Gann believed that a notable trend reversal could be anticipated if the key 1x1 Gann angle line is breached. In that case, prices would then be expected to proceed to trade to the next Gann angle line, and such a breach even indicates that a trend reversal may be in progress.
Conclusion
Gann angles can be a valuable tool to the analyst or trader if used properly. Having an open mind and grasping the key concept that the past, present and future all exist at the same time on a Gann angle can help you analyze and trade a market with more accuracy. Learning the characteristics of the different markets in regard to volatility, price scale and how markets move within the Gann angle framework will help improve your analytical skills.