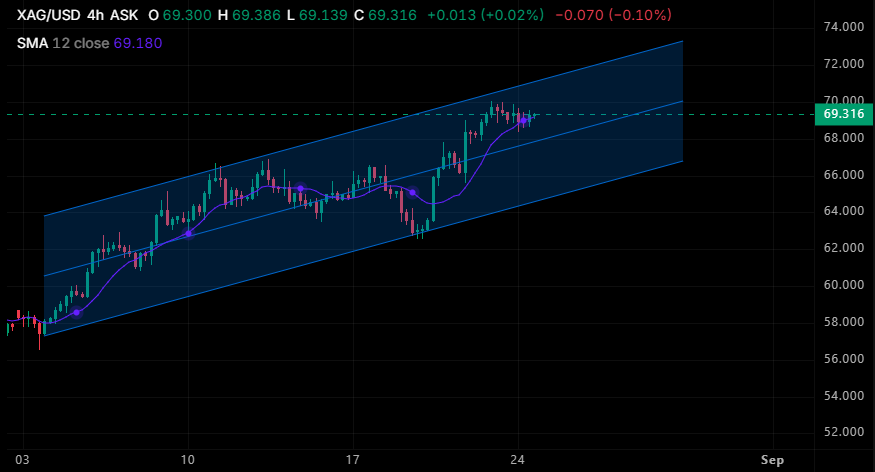
Note: This section contains information in English only.XAG/USD 4-hour chart reflects a sustained bullish market structure within an ascending channel, with price currently pausing around $69.32 just beneath psychological resistance at $70.00. Immediate dynamic support is being provided by the 12-period SMA, keeping the short-term bias titled toward buyers. A decisive breakout above the $70.00 zone would pave the way for a test of the upper boundary near $72.00–$73.00, whereas a failure to sustain above the moving average could prompt a mean-reversion retest toward the lower ascending channel trendline near $65.50–$66.00.
Mon, 24 Aug 2026 12:18:00 GMT
Source: Dukascopy Bank SA