Open trading account

If you haven't seen up until now my last update on Silver I strongly suggest to check it out here: Metals Outlook. Silver Leading The Way Down because that's key to understand why gold is going to follow silver and break lower.
In my last update about gold, and you can check that blog post here:Gold Double Inverted H&S Bottom? I was arguing that on the daily chart we may be developing an inverted H&S pattern which was never confirmed as we need a break of the neck-line. However in that post I was also suggesting that if we break below $1275 we're heading lower and the H&S pattern will be invalidated.
Since than many things have been developing in the markets and the broad base dollar strength has been the main reason for this sell off in gold. It's important to understand the reasons behind current developments in the market in order to be better positioned. As FED is moving away from his easing cycle towards rates normalization this have put in motion new trends aka USD bullish trend. We already know that main impact behind QE was to create inflation and that's the reason why gold was rallying over the past few years, but now that US dollar is going higher this is putting pressure on inflation and thus why gold is under pressure, as the main reason why gold was rallying was precisely the prospect of higher inflation, and now that market theme is no longer available.
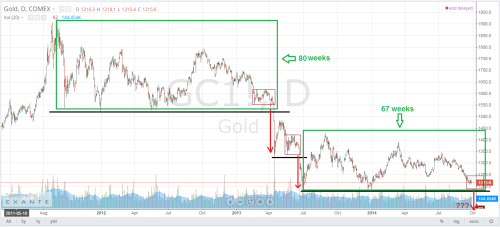
Figure 1. Gold Daily chart (click on figure to enlarge).
Now lets focus on the technicals, and here history of price action continue to play a key role in the Gold decline move. This whole 2014 bottom price structure is a fractal of 2013 which was the precursor of a major sell off. If price is to follow the history we can expect a break lower as it was the case in 2013 but not before we establish a trading box (see red box Figure 1). Now another key factor is the amount of time spent in this ranges on one hand we have the top green box where price spent there 80 weeks and on current range price only spent 67 weeks this align perfectly with the seasonality cycles which suggest that Dec/Jan should produce a breakout and make a swing low.
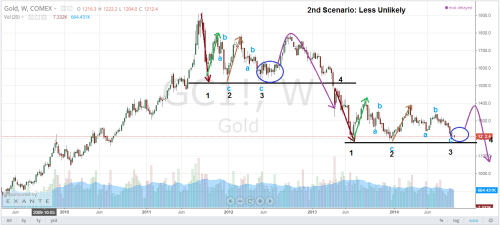
Figure 2. Gold Daily Chart 2nd Scenario(click on figure to enlarge)
The second scenario I have in play, which is more unlikely to happen because of the current fundamental developments in the market that I write earlier, is to have an scenario like in Figure 2 where the price action will follow the price structure from 2013 where we had triple bottom and only on the 4th attempt we succeed to break that support level.
Again before to jump in this trade you have to be advise that this pattern will be valid only once we break and close below the $1180 swing low.
Best Regards,
Daytrader21