Open trading account
Recently, both - B. Bernanke and J. Yellen stated, that they don’t have a clue what drives gold markets. I would say that either, they really are a clueless muppets (as they never speculated in the financial markets, but managing these now with great confidence) or they simply just lie to the public. Hard to choose which option is worst. Gold market, as all the other markets, is driven by dynamics of liquidity and risk to reward game of market movers and the crowd. Fundamental side of the reasoning, sometimes have bigger impact and sometimes don’t have any at all, but technicals play they role at every pip of the range. Someone say technicals give the levels to enter and fundamentals give the direction, I say – technicals give entries and the direction and fundamentals give the timing.
What technicals are the most important and how one should trade these? The answer is fairly simple, but practical usage (trading) is a complex and multi-angular process. First of all – I must remind my stubborn conviction, that all the trend lines, moving averages, most popular technical indicators and other widely used traditional technical analysis tools are not only just useless, but intentionally prompted by biggest players of the markets to drive attention of the crowd away from the real things.
Fibonacci deviations and particularly – the golden ratio is the real deal. Just in most publicized analysis it is applied the wrong way! And more importantly – to have an actual level is not enough to trade it. The sequence is the key. Same Fibonacci number may represent different things in different situations – it all depends on the context of price action developments around the level and in a range or trend overall.
Part of that context is risk to reward conditionality, which determines the exact turning point and the distance of upcoming movement (see “Risk to Reward” section in this article).
The Golden Ratio. It’s a fascinating thing to see, how often golden ratio reveals itself in nature, modern and ancient design and architecture, and the markets. Golden ratio of 1.61.8% makes 38.2% (or 61.8 %) of the future range the most probable place for continuation to happen. All the other Fibonacci deviations are important too, as a part of the same sequence, divided in smaller segments.
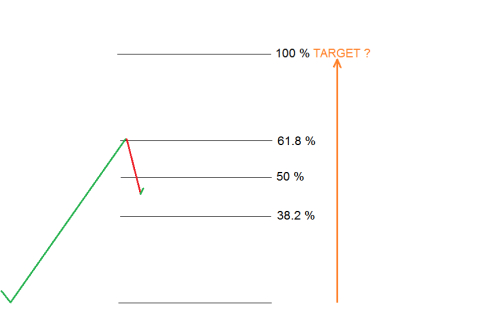 Figure 1.0. At first measure it is purely a guessing game. But as corrections develop, reactions to smaller deviations of possible future range can give very clear picture of where it is going.
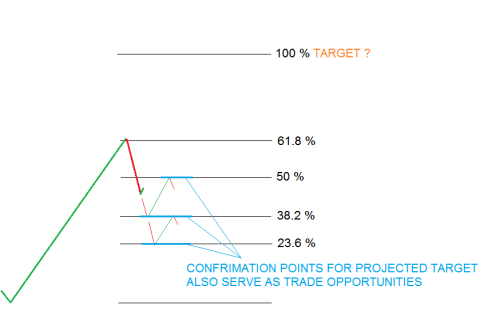 Figure 1.1.
Future Range. People wrongly assume that Fibonacci retracements are God’s given supports and resistances where rejection or continuation should happen. Despite that often Fibonacci retracements of the recent range act as targets, one can never expect such level to hold necessarily or if the level got pierced – it doesn’t mean that the next one is underway. Fibonacci retracements of the range of past is equally delusional as all the other popular technical tools, like trend lines and moving averages. Sometimes, these visible and easily identifiable levels by a crowd actually reverse price and trends continue, but on these occasions, the real reason is that these levels coincide with the deviations of the future range. Reasons for smaller rejections (without continuation of the trend) happening because of precautionary profit taking (risk and money management) and maneuvers by market movers to delude sentiment. Many traders (retailers especially) base their trading systems on these common levels and rejections/breakouts of these levels. And with proper risk and money management they make profits, but in the end it’s an exhausting 50/50 game with little benefit. The real purpose of golden ratio and smaller Fibonacci deviations is to be used for future range – not the past.
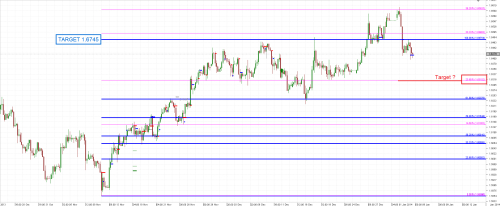 Figure 2.0. Pound had 1.6475 as its short term bull target. Now this level acts as pivotal area for bearish correction or further bullishness to continue. Pink colored sequence marks much farther bull targets at 1.78 area and so far price reacts very precisely to these deviations of possible future range.
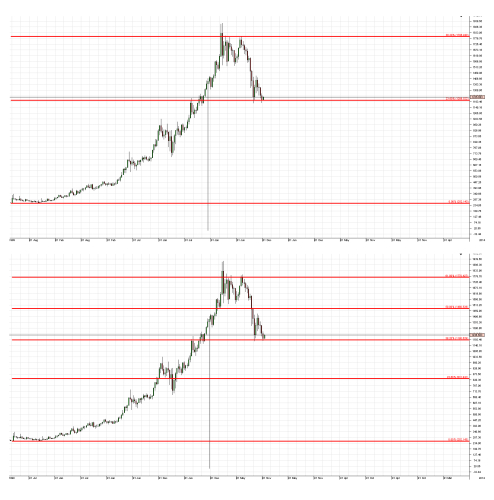 Figure 3.0. Gold have several possible scenarios for future range and maybe all of them will be fulfilled. Ongoing correction will give a clue what future targets are in mind of the market movers.
Invisible levels. Fact of the matter is, that most technical levels, that market movers trade are invisible if you don’t fallow the sequence of the future range. Fibonacci and other mathematical deviations of the past range, together with trend lines, moving averages and various period closing/opening levels falls in to category of visible levels. Visible levels are used for liquidity raids by market movers and are better to be left for reference, not trading.
Risk to Reward (R:R). In my older article “A Simple yet Essential Risk and Money Management Principles” I explained the most essential principles of risk and money management against lows/highs of the range. Now I will explain these principles in more detailed way.
In most situations, 1:1 and 1:2 risk to reward ratios are in play. 1:1 ratio used for precautionary profit taking and it is especially frequent in counter trend situations. One can often spot, that price travels exactly 100% distance from its risk limits for several times before establishing the next direction. For this reason 76.4 % retracement point, despite not being a real fib number, often act notably on price action, because at this level, entries from 38.2% retracement point covers same distance as it was risked on the moment of entry.
From risk and money management stand point of view, if you close half of your position at 100% mark of your risk limits,remaining part of your trade runs free of risk and it can be left for drastic and far targets. Now, if you are a market mover – it’s likely that by closing half of your position, you will bring price back to your entry point (especially if you were the only buyer or seller in to some “major” level or, more common option – buying in to highs and selling in to lows of the range), which gives an opportunity to enter again with that half of designated exposure. And again – market moving position (of the same size or bigger of the original half entry) will push price away. At 100% distance of your risk limits, you close that half again, sending price back to the original entry point, but this time accumulated profits are enough to cover risk limits of a whole position and could be repeated with additional – bigger and more aggressive position, to break the range and target 200% of the risked distances or even much farther beyond.
That’s the very basic risk and money management principle that plays again and again at every visible and invisible level. And that is the main driving force in all the markets most of the time. In less liquid periods or before major movements, these accumulation/distribution maneuvers are more prolonged and choppy, creates all these “classic” PA patterns like flags, wedges, fake spikes and etc. People get lost, trying to analyse these patterns, which are the outcomes, not the reasons of the price action.
1:2 risk to reward ratio by default is a standard target. Often ongoing movement is targeting very exact deviation point beyond the technical level, where it would turn back and target the next range in to opposite direction, in which this technical level in question would appear exactly at 33.33% mark of its upcoming range ( see figure 5.0). It’s like in a chess game – you can see it developing two swings ahead.
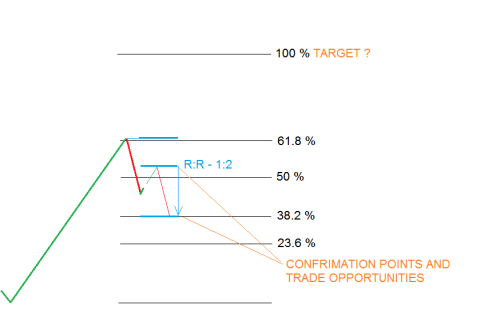 Figure 4.0.

article contest: Likerty
What technicals are the most important and how one should trade these? The answer is fairly simple, but practical usage (trading) is a complex and multi-angular process. First of all – I must remind my stubborn conviction, that all the trend lines, moving averages, most popular technical indicators and other widely used traditional technical analysis tools are not only just useless, but intentionally prompted by biggest players of the markets to drive attention of the crowd away from the real things.
Fibonacci deviations and particularly – the golden ratio is the real deal. Just in most publicized analysis it is applied the wrong way! And more importantly – to have an actual level is not enough to trade it. The sequence is the key. Same Fibonacci number may represent different things in different situations – it all depends on the context of price action developments around the level and in a range or trend overall.
Part of that context is risk to reward conditionality, which determines the exact turning point and the distance of upcoming movement (see “Risk to Reward” section in this article).
The Golden Ratio. It’s a fascinating thing to see, how often golden ratio reveals itself in nature, modern and ancient design and architecture, and the markets. Golden ratio of 1.61.8% makes 38.2% (or 61.8 %) of the future range the most probable place for continuation to happen. All the other Fibonacci deviations are important too, as a part of the same sequence, divided in smaller segments.
 Figure 1.0. At first measure it is purely a guessing game. But as corrections develop, reactions to smaller deviations of possible future range can give very clear picture of where it is going.
 Figure 1.1.
Future Range. People wrongly assume that Fibonacci retracements are God’s given supports and resistances where rejection or continuation should happen. Despite that often Fibonacci retracements of the recent range act as targets, one can never expect such level to hold necessarily or if the level got pierced – it doesn’t mean that the next one is underway. Fibonacci retracements of the range of past is equally delusional as all the other popular technical tools, like trend lines and moving averages. Sometimes, these visible and easily identifiable levels by a crowd actually reverse price and trends continue, but on these occasions, the real reason is that these levels coincide with the deviations of the future range. Reasons for smaller rejections (without continuation of the trend) happening because of precautionary profit taking (risk and money management) and maneuvers by market movers to delude sentiment. Many traders (retailers especially) base their trading systems on these common levels and rejections/breakouts of these levels. And with proper risk and money management they make profits, but in the end it’s an exhausting 50/50 game with little benefit. The real purpose of golden ratio and smaller Fibonacci deviations is to be used for future range – not the past.
 Figure 2.0. Pound had 1.6475 as its short term bull target. Now this level acts as pivotal area for bearish correction or further bullishness to continue. Pink colored sequence marks much farther bull targets at 1.78 area and so far price reacts very precisely to these deviations of possible future range.
 Figure 3.0. Gold have several possible scenarios for future range and maybe all of them will be fulfilled. Ongoing correction will give a clue what future targets are in mind of the market movers.
Invisible levels. Fact of the matter is, that most technical levels, that market movers trade are invisible if you don’t fallow the sequence of the future range. Fibonacci and other mathematical deviations of the past range, together with trend lines, moving averages and various period closing/opening levels falls in to category of visible levels. Visible levels are used for liquidity raids by market movers and are better to be left for reference, not trading.
Risk to Reward (R:R). In my older article “A Simple yet Essential Risk and Money Management Principles” I explained the most essential principles of risk and money management against lows/highs of the range. Now I will explain these principles in more detailed way.
In most situations, 1:1 and 1:2 risk to reward ratios are in play. 1:1 ratio used for precautionary profit taking and it is especially frequent in counter trend situations. One can often spot, that price travels exactly 100% distance from its risk limits for several times before establishing the next direction. For this reason 76.4 % retracement point, despite not being a real fib number, often act notably on price action, because at this level, entries from 38.2% retracement point covers same distance as it was risked on the moment of entry.
From risk and money management stand point of view, if you close half of your position at 100% mark of your risk limits,remaining part of your trade runs free of risk and it can be left for drastic and far targets. Now, if you are a market mover – it’s likely that by closing half of your position, you will bring price back to your entry point (especially if you were the only buyer or seller in to some “major” level or, more common option – buying in to highs and selling in to lows of the range), which gives an opportunity to enter again with that half of designated exposure. And again – market moving position (of the same size or bigger of the original half entry) will push price away. At 100% distance of your risk limits, you close that half again, sending price back to the original entry point, but this time accumulated profits are enough to cover risk limits of a whole position and could be repeated with additional – bigger and more aggressive position, to break the range and target 200% of the risked distances or even much farther beyond.
That’s the very basic risk and money management principle that plays again and again at every visible and invisible level. And that is the main driving force in all the markets most of the time. In less liquid periods or before major movements, these accumulation/distribution maneuvers are more prolonged and choppy, creates all these “classic” PA patterns like flags, wedges, fake spikes and etc. People get lost, trying to analyse these patterns, which are the outcomes, not the reasons of the price action.
1:2 risk to reward ratio by default is a standard target. Often ongoing movement is targeting very exact deviation point beyond the technical level, where it would turn back and target the next range in to opposite direction, in which this technical level in question would appear exactly at 33.33% mark of its upcoming range ( see figure 5.0). It’s like in a chess game – you can see it developing two swings ahead.
 Figure 4.0.
article contest: Likerty