Open trading account
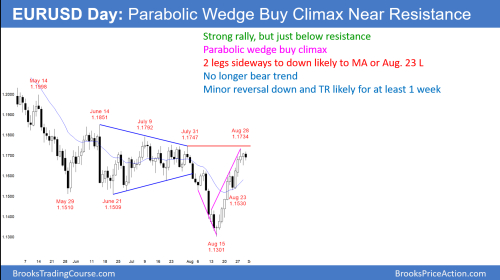
The EURUSD daily Forex chart rallied strongly for 3 weeks to near the top of the 4 month trading range. It has been sideways for 3 days.
The EURUSD daily Forex chart had a bull trend reversal 3 week ago. It is now back in its 4 month trading range. Since traders believed that this was a fair price for many months, they will probably continue to hold this belied until it is clearly wrong.
Consequently, the daily chart might go sideways for several more weeks before breaking out.
Because the weekly chart has been in a bull trend for a year and a half, a bull breakouk. BUt the 3 week rally on the daily chart has been a serious of buy climaxes. When that happens, the bulls typically begin to take profits (exhausted bulls). They then wait for about 10 bars and 2 sideways to down legs before buying again.
This is because they want to test the bears. If the bears are strong, the selloff could be more than 50%. That would allow the bulls to buy again around 1.15, whoch is much cheaper than today. Alternatively, the bears might not be able to drive the market down. Instead, the daily chart could go sideways. If that happens, the bulls will buy again after a sideways High 2 bull flag or a trianlge.
Parabolic wedge buy climax transitions into a trading range
The 3 week parabolic wedge buy climax has been strong and there is room to the top of the 4 month range. Therefore, there might be 1 or 2 more small legs up before there is a 10 bar sideways to down move. However, the bulls will begin to take profits above the high of prior days and the bears will sell there. Also, both will buy below the lows of will take quick profits. This create a trading range.
Overnight EURUSD Forex trading
The bulls bought below Tuesdays low and the bears sold above yesterdays high. Fading breakouts is an early sign of a bull trend evolving into a trading range. The EURUSD 3 minute chart is forming smaller legs. Day traders are taking quick profits. They are looking for reversals, especially from above yesterdays high and below yesterdays low. Therefore the 5 minute chart is back to a scalping market.