The pattern started on the 17th of September, 2012, when the pair peaked above the 200-day SMA to 103.86; currently it is trading at 130.56. Trading volume seems to be volatile in the length of the pattern.; the gap between the pattern's support and resistance narrows by 900 pips in 100 bar period. Technical indicators on aggregate point at appreciation of the pair on 1M horizon suggesting it should continue following pattern's, upward sloping, trend. Long traders could focus on the 20-day SMA/weekly pivot (PP) at 31.41/53, 133.08/87 area (weekly and monthly pivot (R1), Bollinger band, pattern's resistance and recent high) and weekly pivots at 135.36 (R2) and 136.91 (R3).
Note: This section contains information in English only.
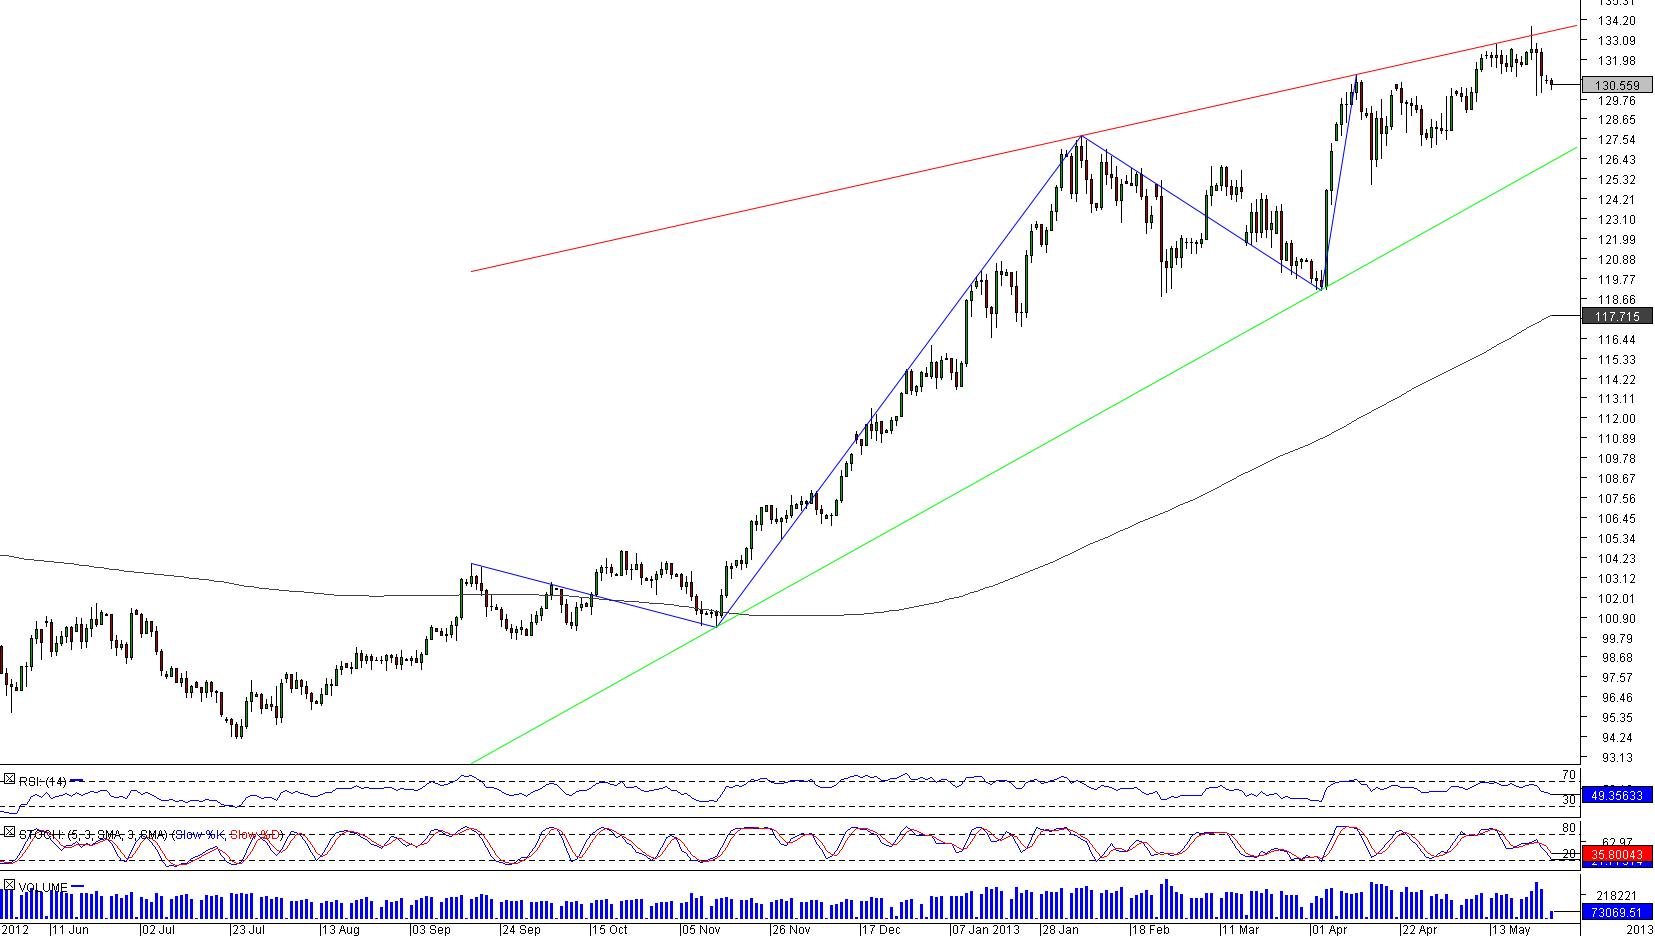
 EUR/JPY has formed a Rising Wedge pattern on the 1D chart. The pattern has 56% quality and 83% magnitude on in the 178-bar period.
The pattern started on the 17th of September, 2012, when the pair peaked above the 200-day SMA to 103.86; currently it is trading at 130.56. Trading volume seems to be volatile in the length of the pattern.; the gap between the pattern's support and resistance narrows by 900 pips in 100 bar period. Technical indicators on aggregate point at appreciation of the pair on 1M horizon suggesting it should continue following pattern's, upward sloping, trend. Long traders could focus on the 20-day SMA/weekly pivot (PP) at 31.41/53, 133.08/87 area (weekly and monthly pivot (R1), Bollinger band, pattern's resistance and recent high) and weekly pivots at 135.36 (R2) and 136.91 (R3).

Mon, 27 May 2013 14:09:35 GMT
Source: Dukascopy Bank SA
© Dukascopy Bank SA
The pattern started on the 17th of September, 2012, when the pair peaked above the 200-day SMA to 103.86; currently it is trading at 130.56. Trading volume seems to be volatile in the length of the pattern.; the gap between the pattern's support and resistance narrows by 900 pips in 100 bar period. Technical indicators on aggregate point at appreciation of the pair on 1M horizon suggesting it should continue following pattern's, upward sloping, trend. Long traders could focus on the 20-day SMA/weekly pivot (PP) at 31.41/53, 133.08/87 area (weekly and monthly pivot (R1), Bollinger band, pattern's resistance and recent high) and weekly pivots at 135.36 (R2) and 136.91 (R3).
At the moment market has bearish tendencies—60% of all outstanding positions are short on the pair. Bollinger band/weekly pivot (S1) at 129.47/24, weekly pivot (S2) at 127.96, pattern's support at 27.03 and 100-day SMA/monthly pivot (PP)/weekly pivot (S3) at 126.34/125.41.
Main fundamental events which could have significant impact on the pairs development in the near future are Bank of Japan governor speech on 28th of May, Spanish 10-y bond auction on 29th of May and 6th of June and ECB's minimum bid rate announcement and press conference on 6th of June.
© Dukascopy Bank SA
Actual Topics
Subscribe to "Fundamental Analysis" feed
Подписаться
Чтобы узнать больше о торговой платформе Forex/CFD, SWFX и получить другую информацию, связанную с торговлей,
пожалуйста, звоните нам или запросите обратный звонок.
пожалуйста, звоните нам или запросите обратный звонок.
Для получения дополнительной информации относительно сотрудничества,
пожалуйста, позвоните нам или запросите обратный звонок.
пожалуйста, позвоните нам или запросите обратный звонок.
Чтобы узнать больше о торговых платформах (Forex / Бинарные опционы) от Dukascopy Bank, торговой площадке SWFX или получить другую информацию, связанную с торговлей,
пожалуйста, позвоните нам или запросите обратный звонок.
пожалуйста, позвоните нам или запросите обратный звонок.
Чтобы узнать больше о торговой платформе Forex/CFD, SWFX и получить другую информацию, связанную с торговлей,
пожалуйста, звоните нам или запросите обратный звонок.
пожалуйста, звоните нам или запросите обратный звонок.
Чтобы узнать больше о Крипто / CFD / Forex торговых платформах, SWFX и получить другую информацию, связанную с торговлей,
пожалуйста, позвоните нам или запросите обратный звонок.
пожалуйста, позвоните нам или запросите обратный звонок.
Чтобы узнать больше о Представляющих агентах и получить другую информацию, связанную с торговлей,
пожалуйста, позвоните нам или запросите обратный звонок.
пожалуйста, позвоните нам или запросите обратный звонок.
Для получения дополнительной информации относительно сотрудничества,
пожалуйста, позвоните нам или запросите обратный звонок.
пожалуйста, позвоните нам или запросите обратный звонок.