Note: This section contains information in English only.
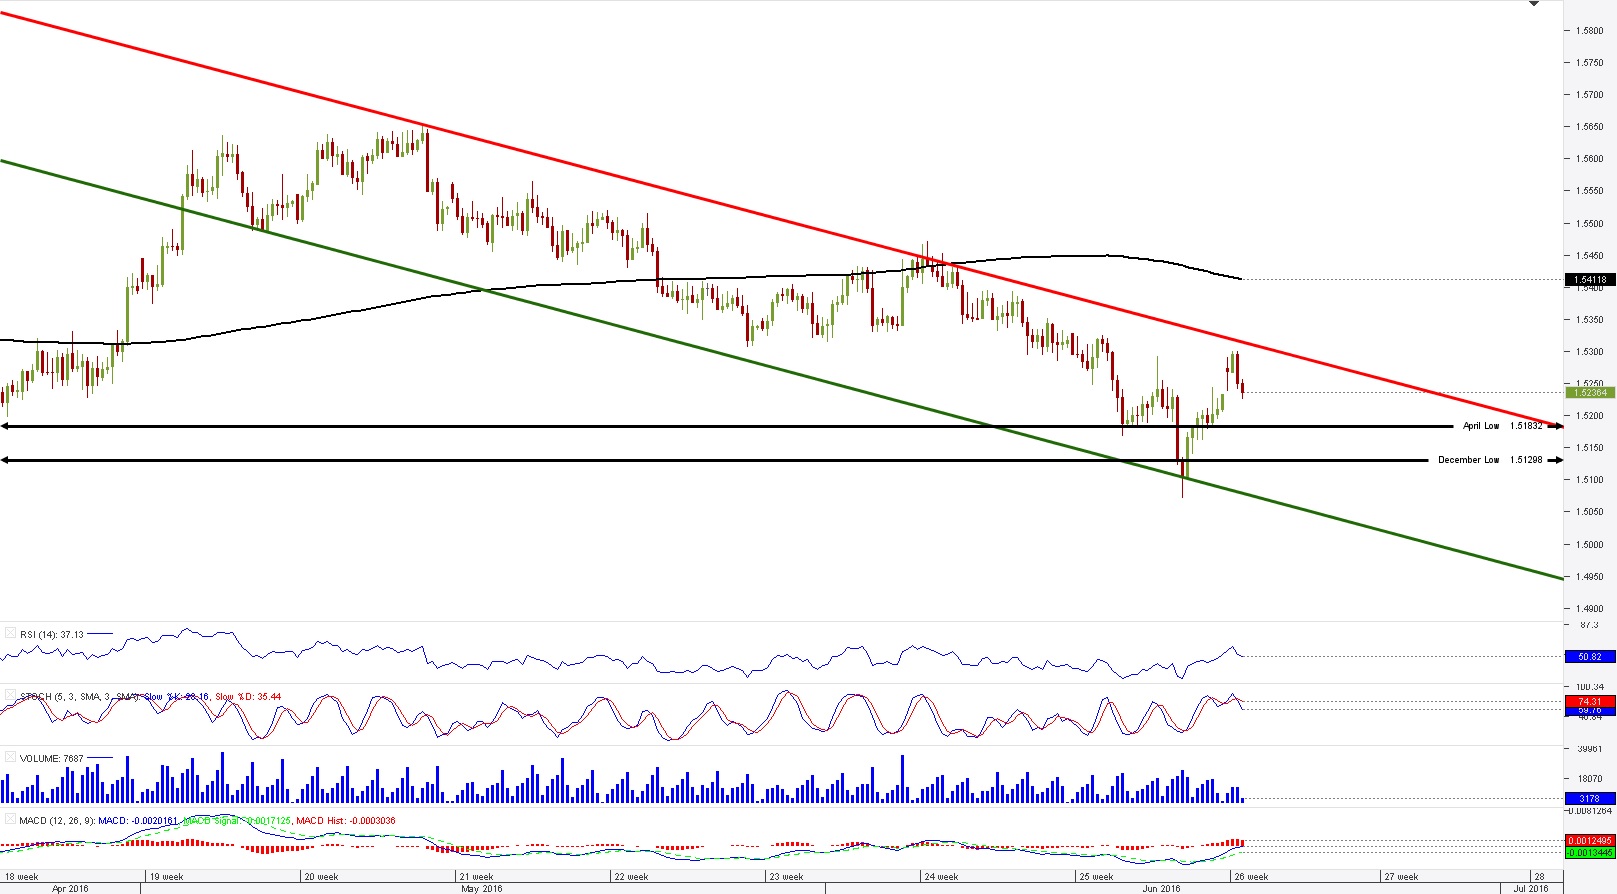
 The European currency is in a channel down pattern against the Singapore Dollar, and at the moment the rate has bounced off the upper trend line. However, it seems, that the rate bounced off the trend line early and without confirming it for a third confirmation. The currency exchange rate is at 1.5236, and it is approaching a cluster of resistances around the level of 1.5211. The cluster is made up of the monthly S1, weekly PP, 55 and 100 day SMAs. Afterwards the pair could face the April and December lows respectively at 1.5183 and 1.5130. Although, the EUR/SGD pair looks oversold, as 72% of SWFX open positions are short.

Mon, 20 Jun 2016 12:03:24 GMT
Source: Dukascopy Bank SA
© Dukascopy Bank SA
© Dukascopy Bank SA
Actual Topics
Subscribe to "Fundamental Analysis" feed
Suscribir
Para conocer más sobre la plataforma de Trading de CFD y Forex de Dukascopy Bank, SWFX y otras informaciones relacionadas con el Trading,
llámenos o haga una solicitud de devolución de llamada.
llámenos o haga una solicitud de devolución de llamada.
Para obtener más información sobre la posible cooperación, por favor llámenos o haga una solicitud de devolución de llamada.
Para obtener más información sobre las opciones binarias de Dukascopy Bank
/ La plataforma de operaciones de Forex, SWFX y otra información relacionada con el Trading, por favor llámenos o solicite una devolución de llamada.
Para conocer más sobre la plataforma de Trading de CFD y Forex de Dukascopy Bank, SWFX y otras informaciones relacionadas con el Trading,
llámenos o haga una solicitud de devolución de llamada.
llámenos o haga una solicitud de devolución de llamada.
Para obtener más información acerca de la plataforma de operaciones Crypto Trading / CFD / Forex, SWFX y otra información relacionada con el comercio,
llámenos o realice una solicitud de devolución de llamada.
llámenos o realice una solicitud de devolución de llamada.
Para obtener más información sobre Business Introducer y otra información relacionada con el comercio,
llámenos o realice una solicitud de devolución de llamada.
llámenos o realice una solicitud de devolución de llamada.
Para obtener más información sobre la posible cooperación, por favor llámenos o haga una solicitud de devolución de llamada.