Note: This section contains information in English only.
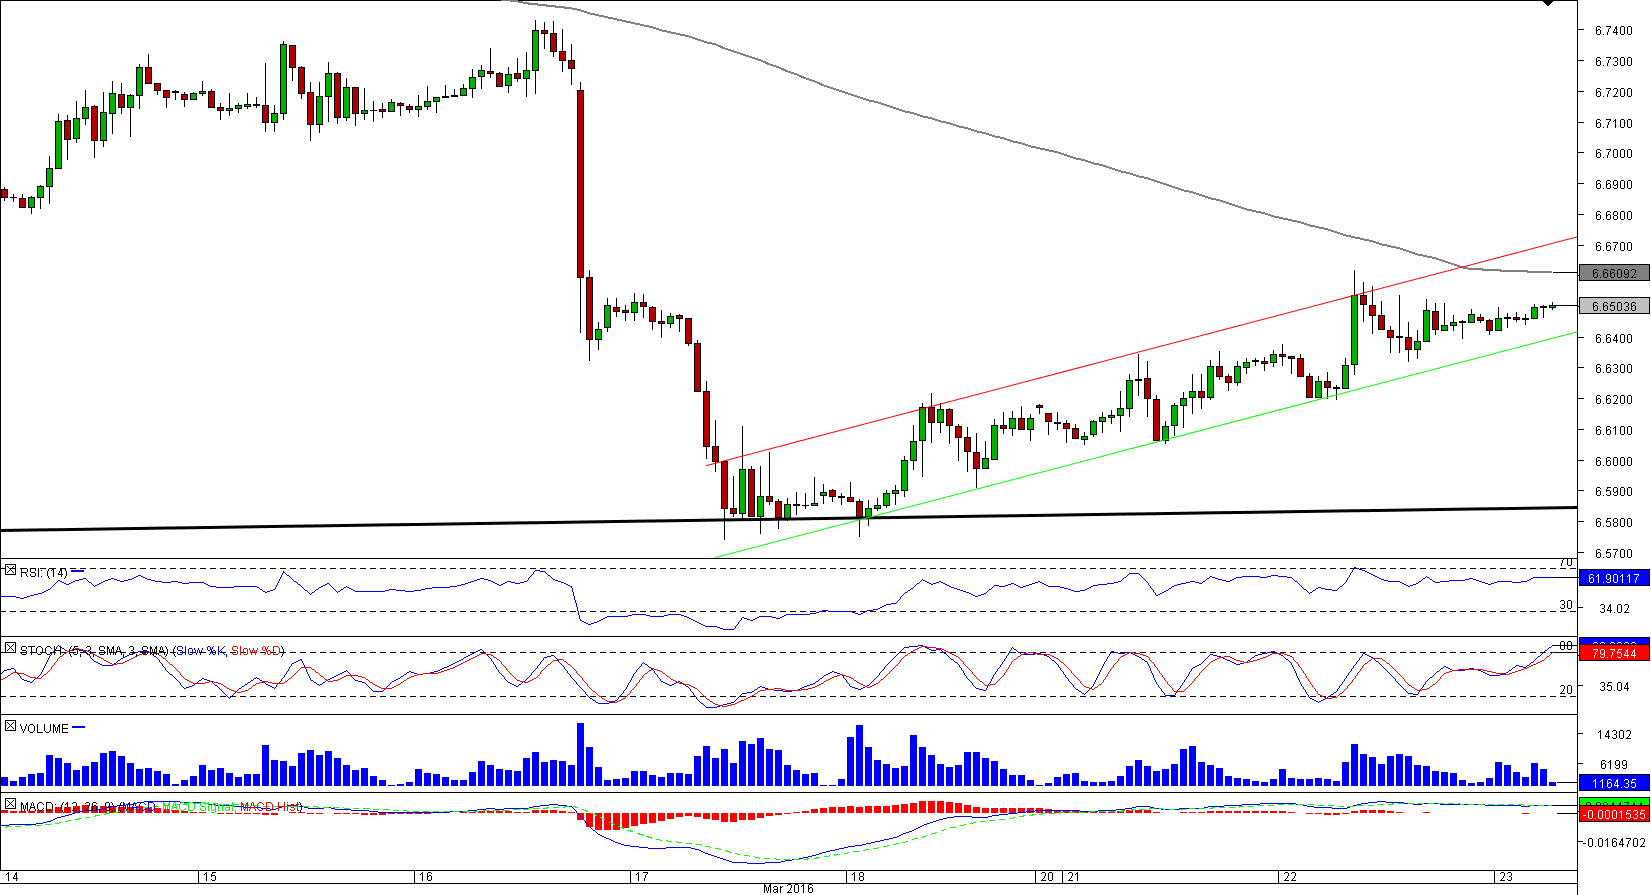
 The US Dollar is expected to keep appreciating against the Danish Krone. USD/DKK has recently established a well-defined bullish channel after confirming a major support up-trend line at 6.58, meaning the near-term dips are to be limited by the weekly pivot point and the lower boundary of the pattern at 6.6436/21. At the same time, we should be wary of a strong resistance area at 6.6650/00, created by the daily R1, March 22 high and 200-hour SMA. If this obstacle is overcome, the pair is likely to steer for the weekly R1 at 6.7130 next. Alternatively, should the rate sink under 6.6436/21, the sell-off will presumably extend down to 6.5850. Meanwhile, the US Dollar is to some extent overbought, being that 63% of open positions are long.

Wed, 23 Mar 2016 07:16:41 GMT
Source: Dukascopy Bank SA
© Dukascopy Bank SA
© Dukascopy Bank SA
Actual Topics
Subscribe to "Fundamental Analysis" feed
Suscribir
Para conocer más sobre la plataforma de Trading de CFD y Forex de Dukascopy Bank, SWFX y otras informaciones relacionadas con el Trading,
llámenos o haga una solicitud de devolución de llamada.
llámenos o haga una solicitud de devolución de llamada.
Para obtener más información sobre la posible cooperación, por favor llámenos o haga una solicitud de devolución de llamada.
Para obtener más información sobre las opciones binarias de Dukascopy Bank
/ La plataforma de operaciones de Forex, SWFX y otra información relacionada con el Trading, por favor llámenos o solicite una devolución de llamada.
Para conocer más sobre la plataforma de Trading de CFD y Forex de Dukascopy Bank, SWFX y otras informaciones relacionadas con el Trading,
llámenos o haga una solicitud de devolución de llamada.
llámenos o haga una solicitud de devolución de llamada.
Para obtener más información acerca de la plataforma de operaciones Crypto Trading / CFD / Forex, SWFX y otra información relacionada con el comercio,
llámenos o realice una solicitud de devolución de llamada.
llámenos o realice una solicitud de devolución de llamada.
Para obtener más información sobre Business Introducer y otra información relacionada con el comercio,
llámenos o realice una solicitud de devolución de llamada.
llámenos o realice una solicitud de devolución de llamada.
Para obtener más información sobre la posible cooperación, por favor llámenos o haga una solicitud de devolución de llamada.