Note: This section contains information in English only.
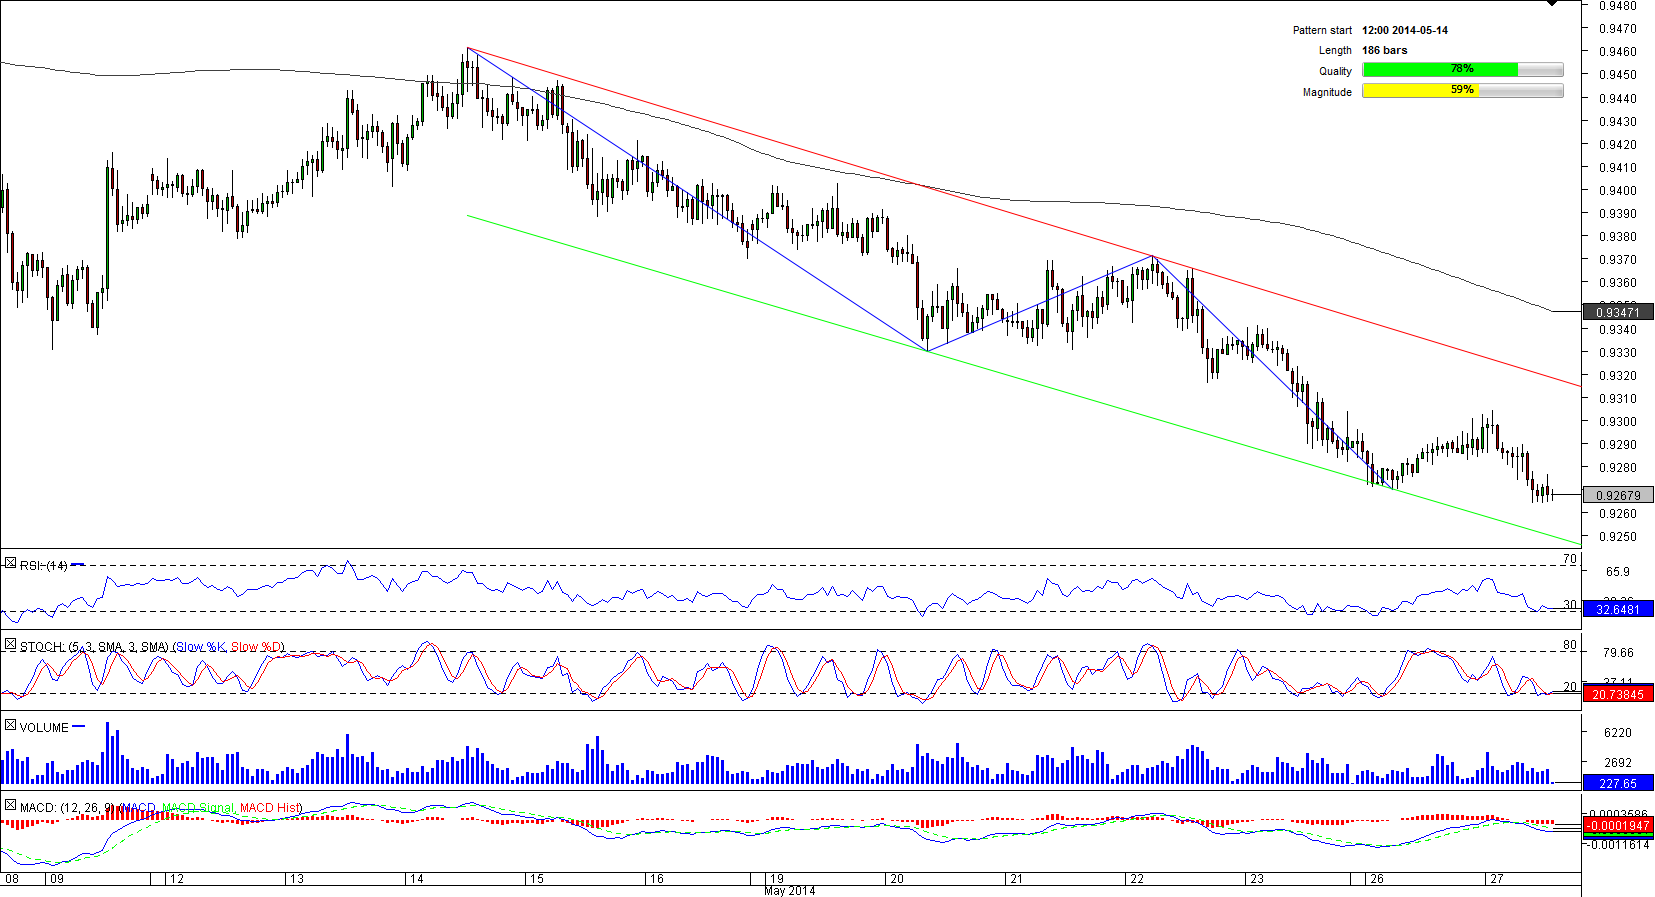
 The pattern was initiated back in mid-May, when the currency pair was stopped by the selling pressure just above 0.9450. Since then the kiwi has been generally underperforming relative to the loonie, thereby forming a bearish channel. Accordingly, while we may expect a recovery in the near-term due to the proximity of the spot to the lower trend-line, the overall outlook is negative towards NZD/CAD, and any rally should be halted at 0.93, where the upper trend-line of the corridor is reinforced by the daily R1 level and May 27 high. In the meantime, the sentiment of the SWFX market is bearish with respect to the pair—73% of open positions are short.

Tue, 27 May 2014 13:43:34 GMT
Source: Dukascopy Bank SA
© Dukascopy Bank SA
© Dukascopy Bank SA
Actual Topics
Subscribe to "Fundamental Analysis" feed
Suscribir
Para conocer más sobre la plataforma de Trading de CFD y Forex de Dukascopy Bank, SWFX y otras informaciones relacionadas con el Trading,
llámenos o haga una solicitud de devolución de llamada.
llámenos o haga una solicitud de devolución de llamada.
Para obtener más información sobre la posible cooperación, por favor llámenos o haga una solicitud de devolución de llamada.
Para obtener más información sobre las opciones binarias de Dukascopy Bank
/ La plataforma de operaciones de Forex, SWFX y otra información relacionada con el Trading, por favor llámenos o solicite una devolución de llamada.
Para conocer más sobre la plataforma de Trading de CFD y Forex de Dukascopy Bank, SWFX y otras informaciones relacionadas con el Trading,
llámenos o haga una solicitud de devolución de llamada.
llámenos o haga una solicitud de devolución de llamada.
Para obtener más información acerca de la plataforma de operaciones Crypto Trading / CFD / Forex, SWFX y otra información relacionada con el comercio,
llámenos o realice una solicitud de devolución de llamada.
llámenos o realice una solicitud de devolución de llamada.
Para obtener más información sobre Business Introducer y otra información relacionada con el comercio,
llámenos o realice una solicitud de devolución de llamada.
llámenos o realice una solicitud de devolución de llamada.
Para obtener más información sobre la posible cooperación, por favor llámenos o haga una solicitud de devolución de llamada.