Note: This section contains information in English only.
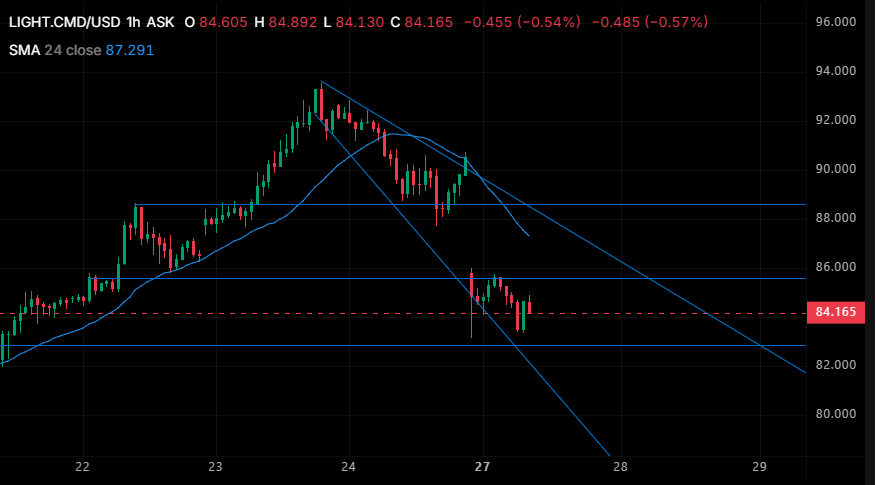
LIGHT.CMD/USD is in a clear short-term bearish downtrend, strictly contained within a descending channel following its drop from recent highs near 94.00. Price remains well below the downward-sloping 24-period SMA, signaling strong overhead pressure, with immediate horizontal resistance sitting at 86.00 and key channel resistance near 88.30–88.50. On the downside, immediate support holds at 82.50–83.00, a clean break below this zone opens the door to 80.00, while a bullish reversal would require a decisive breakout above 86.00 to target 87.30 and beyond.
Mon, 27 Jul 2026 08:14:45 GMT
Source: Dukascopy Bank SA
Actual Topics
Para conocer más sobre la plataforma de Trading de CFD y Forex de Dukascopy Bank, SWFX y otras informaciones relacionadas con el Trading,
llámenos o haga una solicitud de devolución de llamada.
llámenos o haga una solicitud de devolución de llamada.
Para obtener más información sobre la posible cooperación, por favor llámenos o haga una solicitud de devolución de llamada.
Para obtener más información sobre las opciones binarias de Dukascopy Bank
/ La plataforma de operaciones de Forex, SWFX y otra información relacionada con el Trading, por favor llámenos o solicite una devolución de llamada.
Para conocer más sobre la plataforma de Trading de CFD y Forex de Dukascopy Bank, SWFX y otras informaciones relacionadas con el Trading,
llámenos o haga una solicitud de devolución de llamada.
llámenos o haga una solicitud de devolución de llamada.
Para obtener más información acerca de la plataforma de operaciones Crypto Trading / CFD / Forex, SWFX y otra información relacionada con el comercio,
llámenos o realice una solicitud de devolución de llamada.
llámenos o realice una solicitud de devolución de llamada.
Para obtener más información sobre Business Introducer y otra información relacionada con el comercio,
llámenos o realice una solicitud de devolución de llamada.
llámenos o realice una solicitud de devolución de llamada.
Para obtener más información sobre la posible cooperación, por favor llámenos o haga una solicitud de devolución de llamada.