Indicators on aggregate point at a bear market outbreak on the 1D time horizon. Short traders could focus on the daily support level at 1.0267. If the pair breaches this level, next possible target could be at 1.0252.
Note: This section contains information in English only.
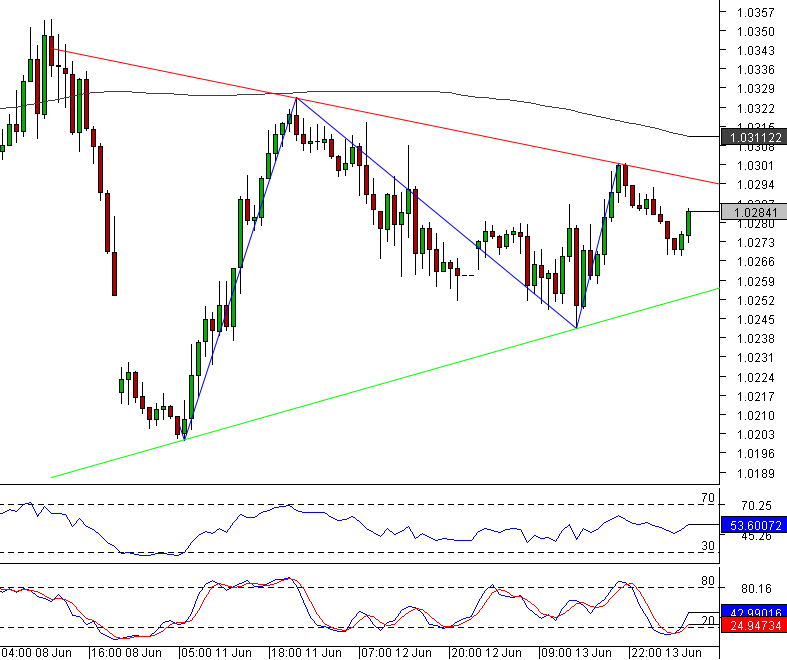
 USD/CAD has formed a Rising Wedge pattern on the 1H chart. The pattern has 83% quality and 62% magnitude in the 82-bar period.
Indicators on aggregate point at a bear market outbreak on the 1D time horizon. Short traders could focus on the daily support level at 1.0267. If the pair breaches this level, next possible target could be at 1.0252.

Thu, 14 Jun 2012 07:29:11 GMT
Source: Dukascopy Bank SA
© Dukascopy Bank SA
The pattern started when the pair bounced from 1.0201 and after testing resistance levels at 1.0352 and 1.0302 it has slowed down at 1.0284 where the pair is currently trading. Pattern support and resistance lines intercept on 15th June at the level of 1.0278. Indicators on aggregate do not suggest any clear emerging trends on the 1H and 4H time horizons, but the Stochastic indicator on the 1H time horizon points at a bull market outbreak. Current market sentiment is 90/10 in favor for the bulls as well. Long traders could focus on the daily resistance level at 1.0299. If this level is breached, next target could be at 1.0313.
Indicators on aggregate point at a bear market outbreak on the 1D time horizon. Short traders could focus on the daily support level at 1.0267. If the pair breaches this level, next possible target could be at 1.0252.
© Dukascopy Bank SA
Actual Topics
Subscribe to "Fundamental Analysis" feed
订阅
欲了解更多有关杜高斯贝银行差价合约/外汇交易平台,SWFX和其它相关交易详情,
请致电我们或要求回电。
请致电我们或要求回电。
For further information regarding potential cooperation,
please call us or make callback request.
please call us or make callback request.
To learn more about Dukascopy Bank Binary Options
/ Forex trading platform, SWFX and other trading related information,
please call us or make callback request.
please call us or make callback request.
欲了解更多有关杜高斯贝银行差价合约/外汇交易平台,SWFX和其它相关交易详情,
请致电我们或要求回电。
请致电我们或要求回电。
To learn more about Crypto Trading / CFD / Forex trading platform, SWFX and other trading related information,
please call us or make callback request.
please call us or make callback request.
To learn more about Business Introducer and other trading related information,
please call us or make callback request.
please call us or make callback request.
For further information regarding potential cooperation,
please call us or make callback request.
please call us or make callback request.