© Dukascopy Bank SA
Note: This section contains information in English only.
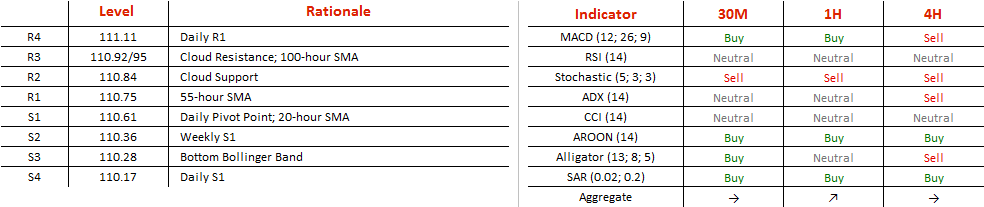
After tests of 118.19, the annual high, in December 2016, USD/JPY left the area and has now entered a conclusively bearish setting in a channel down pattern on the hourly chart. The pair is currently testing the upper boundary of the pattern at 110.66 and, while we expect it to stay inside the bounds of the pattern, there are upside risks in sight. A cloud resistance along with several other indicators provides solid supply pressures just above the channel lines, meaning that if the rate manages to break to the upside, a correction should definitely take place. In case, however, the pair does remain inside the channel, 110.29 will be the first resistance, but 109.11 – the ultimate one.
Tue, 28 Mar 2017 06:35:16 GMT
Source: Dukascopy Bank SA
Actual Topics
Subscribe to "Fundamental Analysis" feed
订阅
欲了解更多有关杜高斯贝银行差价合约/外汇交易平台,SWFX和其它相关交易详情,
请致电我们或要求回电。
请致电我们或要求回电。
For further information regarding potential cooperation,
please call us or make callback request.
please call us or make callback request.
To learn more about Dukascopy Bank Binary Options
/ Forex trading platform, SWFX and other trading related information,
please call us or make callback request.
please call us or make callback request.
欲了解更多有关杜高斯贝银行差价合约/外汇交易平台,SWFX和其它相关交易详情,
请致电我们或要求回电。
请致电我们或要求回电。
To learn more about Crypto Trading / CFD / Forex trading platform, SWFX and other trading related information,
please call us or make callback request.
please call us or make callback request.
To learn more about Business Introducer and other trading related information,
please call us or make callback request.
please call us or make callback request.
For further information regarding potential cooperation,
please call us or make callback request.
please call us or make callback request.