© Dukascopy Bank SA
Note: This section contains information in English only.
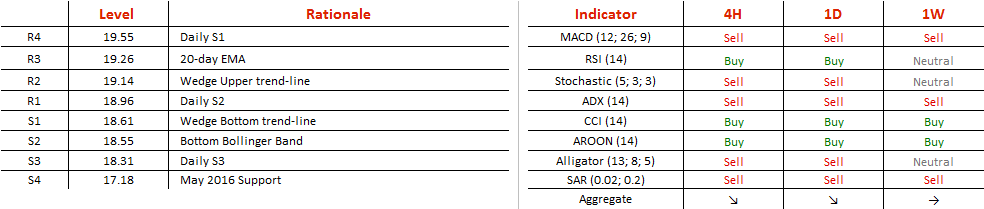
USD/MXN set an all-time high of 21.97 in January 2016, but then the Mexican Peso managed to depreciate and the pair extended a steep downfall which has lasted for three months already. The rate has, however, now sketched a falling wedge on the daily chart and recovered some of the previous bullish potential. The wedge is expected to break around 19.14 to the upside and would open the way for tests of 19.26, the 20-day EMA. Immediate support lies at 19.61 and is unlikely to give access to levels below, at least not before decent tests of the area.
Mon, 27 Mar 2017 08:29:05 GMT
Source: Dukascopy Bank SA
Actual Topics
Subscribe to "Fundamental Analysis" feed
订阅
欲了解更多有关杜高斯贝银行差价合约/外汇交易平台,SWFX和其它相关交易详情,
请致电我们或要求回电。
请致电我们或要求回电。
For further information regarding potential cooperation,
please call us or make callback request.
please call us or make callback request.
To learn more about Dukascopy Bank Binary Options
/ Forex trading platform, SWFX and other trading related information,
please call us or make callback request.
please call us or make callback request.
欲了解更多有关杜高斯贝银行差价合约/外汇交易平台,SWFX和其它相关交易详情,
请致电我们或要求回电。
请致电我们或要求回电。
To learn more about Crypto Trading / CFD / Forex trading platform, SWFX and other trading related information,
please call us or make callback request.
please call us or make callback request.
To learn more about Business Introducer and other trading related information,
please call us or make callback request.
please call us or make callback request.
For further information regarding potential cooperation,
please call us or make callback request.
please call us or make callback request.