Note: This section contains information in English only.
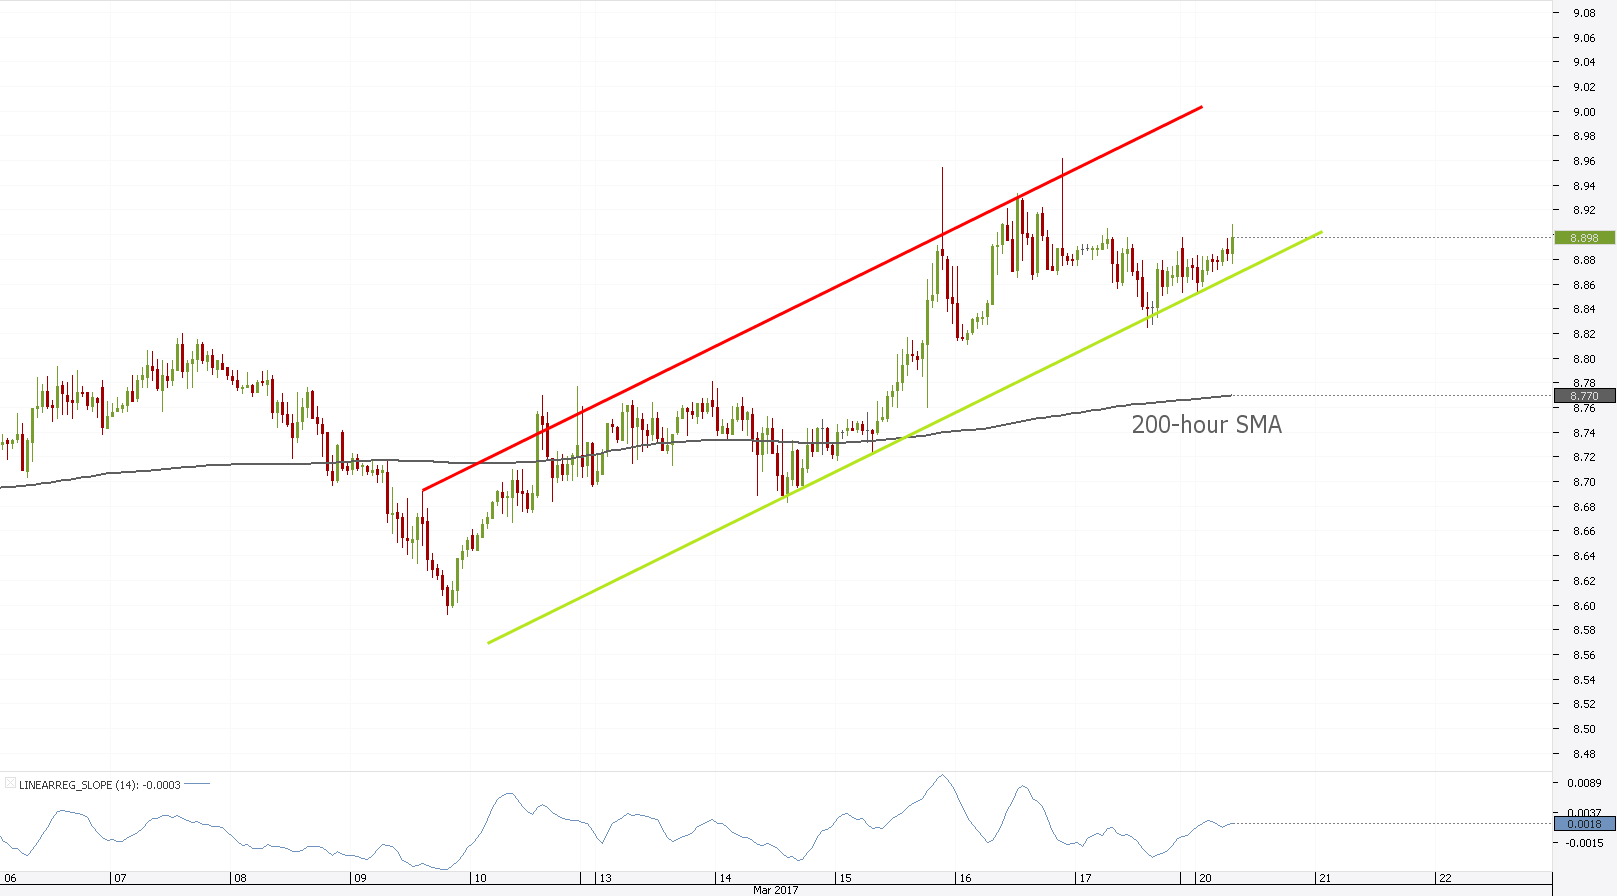
 ZAR/JPY continued its way into areas unconquered since 2015 and managed to show solid bullish potential by confirming an upward sloping channel on the hourly chart. The ultimate target could now lie at 9.203, the resistance of September and October 2015 where supply could take over and lead to a slide. The pair is currently squeezed in between a set of areas and has had some trouble distancing itself from the bottom boundary of the pattern, but a rise above 8.90 should be enough for a surge to extend. In case this successfully happens, the rate should target the upper trend-line of the channel.

Mon, 20 Mar 2017 08:37:50 GMT
Source: Dukascopy Bank SA
© Dukascopy Bank SA
© Dukascopy Bank SA
Actual Topics
Subscribe to "Fundamental Analysis" feed
订阅
欲了解更多有关杜高斯贝银行差价合约/外汇交易平台,SWFX和其它相关交易详情,
请致电我们或要求回电。
请致电我们或要求回电。
For further information regarding potential cooperation,
please call us or make callback request.
please call us or make callback request.
To learn more about Dukascopy Bank Binary Options
/ Forex trading platform, SWFX and other trading related information,
please call us or make callback request.
please call us or make callback request.
欲了解更多有关杜高斯贝银行差价合约/外汇交易平台,SWFX和其它相关交易详情,
请致电我们或要求回电。
请致电我们或要求回电。
To learn more about Crypto Trading / CFD / Forex trading platform, SWFX and other trading related information,
please call us or make callback request.
please call us or make callback request.
To learn more about Business Introducer and other trading related information,
please call us or make callback request.
please call us or make callback request.
For further information regarding potential cooperation,
please call us or make callback request.
please call us or make callback request.