Note: This section contains information in English only.
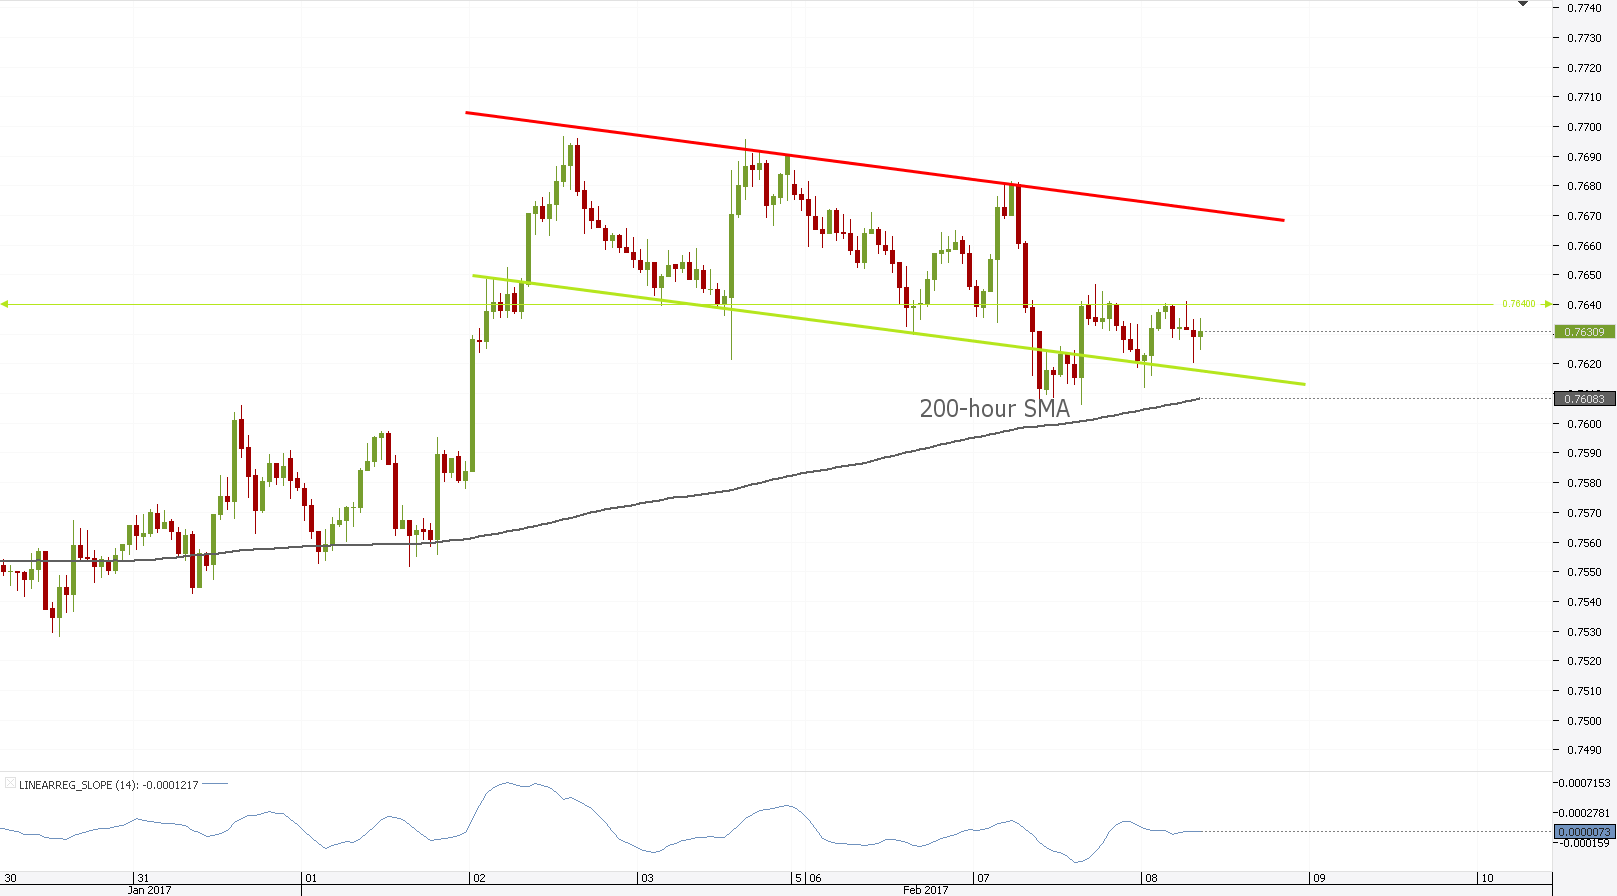
 Following our previous analysis of the double top pattern for AUD/USD, some interesting developments have led to new signals on the hourly chart. The pair managed to break the neckline of the pattern but failed to distance itself from it enough for us to gain a solid bearish signal, however, it went on to break the bottom boundary of the descending channel and showed some significant trend-lines. While the market is ranging after the break below the neck-line, we still see more bearish than bullish pressures on the chart and will look for a repeated break below the bottom boundary of the channel around 0.7618. The upper bound at 0.7640 and the lower one at 0.7618 will be the areas which will indicate whether the market remains bearish or turns to the bullish side.

Wed, 08 Feb 2017 09:27:24 GMT
Source: Dukascopy Bank SA
© Dukascopy bank SA
© Dukascopy bank SA
Actual Topics
Subscribe to "Fundamental Analysis" feed
订阅
欲了解更多有关杜高斯贝银行差价合约/外汇交易平台,SWFX和其它相关交易详情,
请致电我们或要求回电。
请致电我们或要求回电。
For further information regarding potential cooperation,
please call us or make callback request.
please call us or make callback request.
To learn more about Dukascopy Bank Binary Options
/ Forex trading platform, SWFX and other trading related information,
please call us or make callback request.
please call us or make callback request.
欲了解更多有关杜高斯贝银行差价合约/外汇交易平台,SWFX和其它相关交易详情,
请致电我们或要求回电。
请致电我们或要求回电。
To learn more about Crypto Trading / CFD / Forex trading platform, SWFX and other trading related information,
please call us or make callback request.
please call us or make callback request.
To learn more about Business Introducer and other trading related information,
please call us or make callback request.
please call us or make callback request.
For further information regarding potential cooperation,
please call us or make callback request.
please call us or make callback request.