Note: This section contains information in English only.
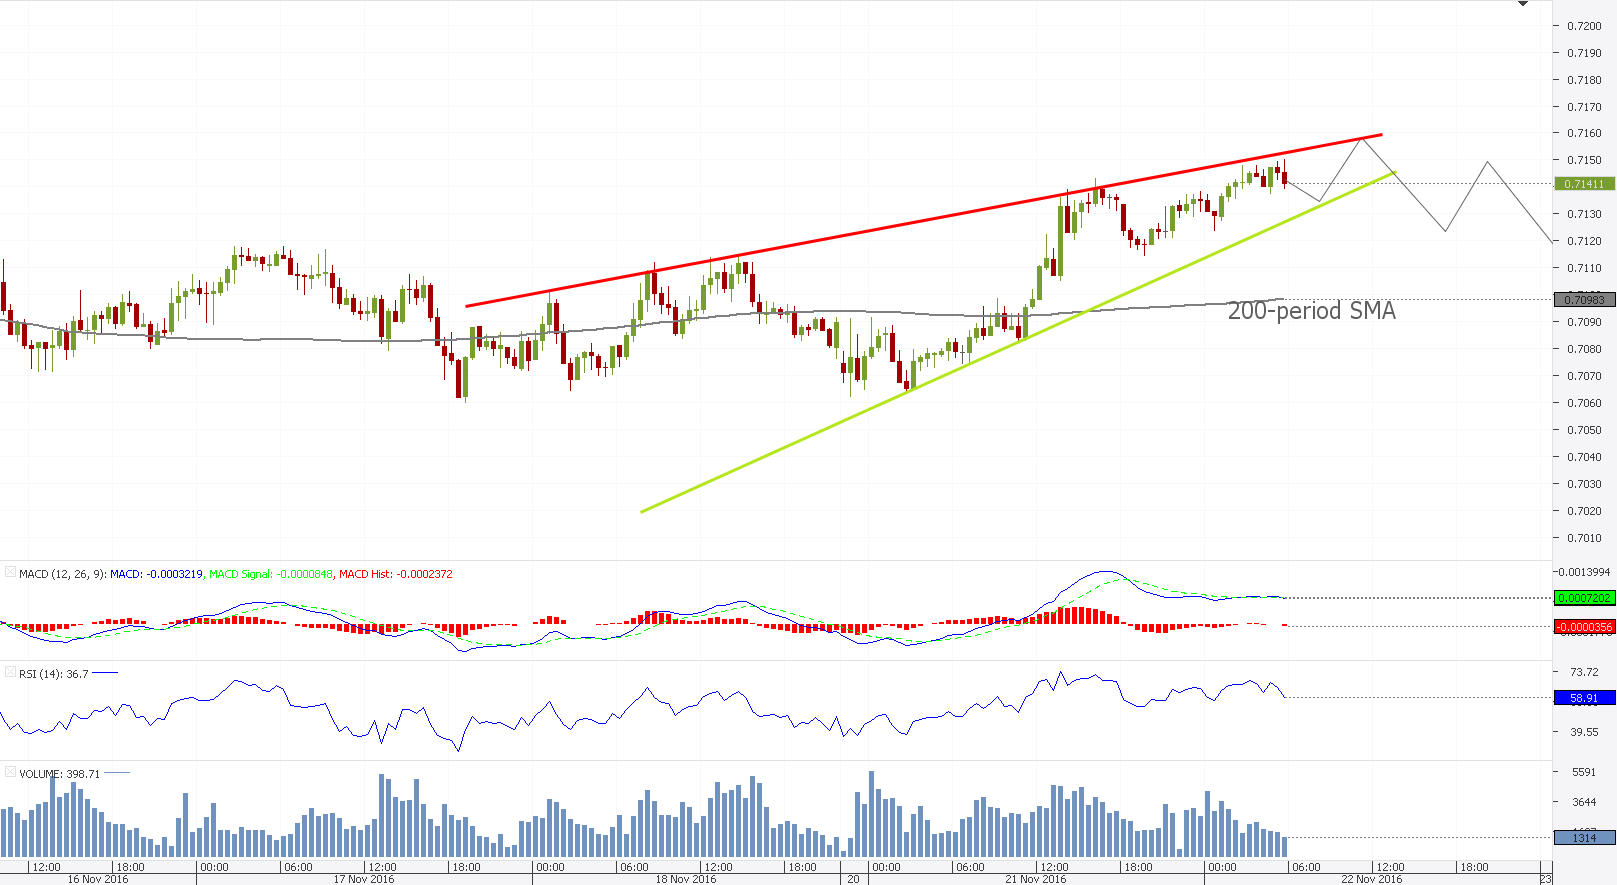
 NZD/CHF recently distanced itself from the bottom trend-line of the five-day rising wedge and established a trading range on the middle and upper part of the pattern. The top trend-line is strengthened by a Bollinger Band and should hold the pair below, leading to a downward breakout eventually. A reversal will require strong bearish potential, as the pair will face a tough and extensive demand area between 0.7127 and 0.7070 with various time-frame SMAs, a green Ichimoku cloud, Pivot Points and a Bollinger Band all as one trying to elevate the rate. In case the pair manages to overstep the upper trend-line of the wedge following repeated tests of supply, it will come

Tue, 22 Nov 2016 06:55:16 GMT
Source: Dukascopy Bank SA
© Dukascopy Bank SA
© Dukascopy Bank SA
Actual Topics
Subscribe to "Fundamental Analysis" feed
订阅
欲了解更多有关杜高斯贝银行差价合约/外汇交易平台,SWFX和其它相关交易详情,
请致电我们或要求回电。
请致电我们或要求回电。
For further information regarding potential cooperation,
please call us or make callback request.
please call us or make callback request.
To learn more about Dukascopy Bank Binary Options
/ Forex trading platform, SWFX and other trading related information,
please call us or make callback request.
please call us or make callback request.
欲了解更多有关杜高斯贝银行差价合约/外汇交易平台,SWFX和其它相关交易详情,
请致电我们或要求回电。
请致电我们或要求回电。
To learn more about Crypto Trading / CFD / Forex trading platform, SWFX and other trading related information,
please call us or make callback request.
please call us or make callback request.
To learn more about Business Introducer and other trading related information,
please call us or make callback request.
please call us or make callback request.
For further information regarding potential cooperation,
please call us or make callback request.
please call us or make callback request.