Note: This section contains information in English only.
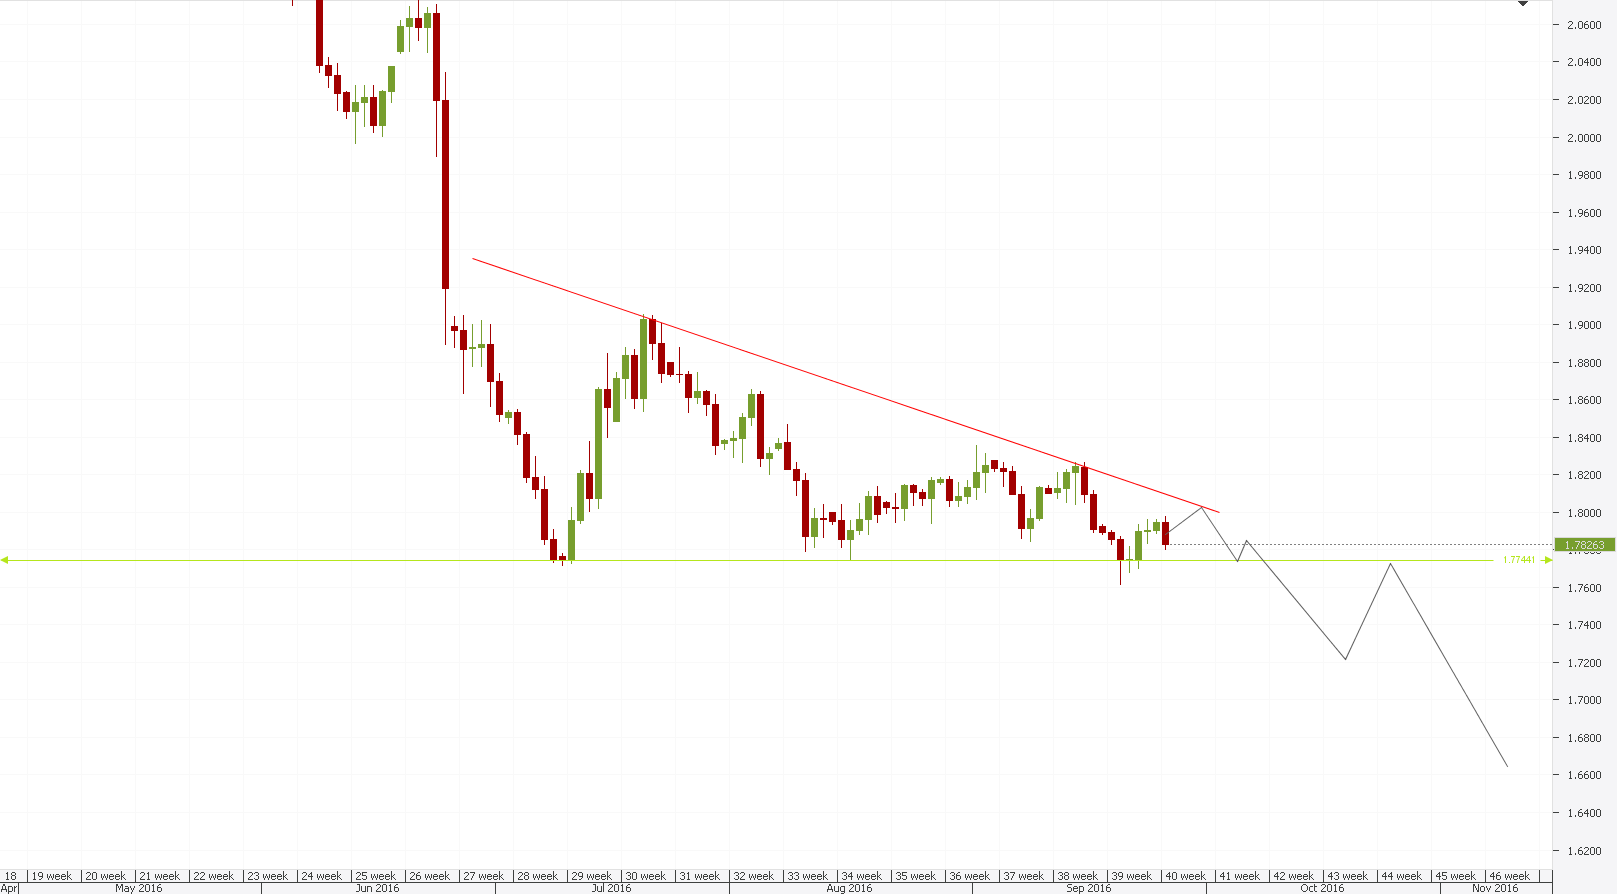
 The descending triangle formed over the last three months has led GBP/NZD to lose volatility to an extent that might imply that the pattern is mature enough to break over late September or early October. The bearish stance taken by the pair threatens to close below the weekly Pivot Point which could, in turn, imply that there will be no final wave to the upper trend-line, but an immediate break below 1.7744, the bottom trend-line of the triangle. This would induce a fall to 1.7722, 1.7703 or 1.7643 before a correction towards the broken trend-line. In case the rate does, however, execute the surge towards 1.8031, the upper trend-line of the triangle, 1.7959, the 20-period SMA could mess with the momentum on the way.

Mon, 26 Sep 2016 15:09:04 GMT
Source: Dukascopy Bank SA
© Dukascopy Bank SA
© Dukascopy Bank SA
Actual Topics
Subscribe to "Fundamental Analysis" feed
订阅
欲了解更多有关杜高斯贝银行差价合约/外汇交易平台,SWFX和其它相关交易详情,
请致电我们或要求回电。
请致电我们或要求回电。
For further information regarding potential cooperation,
please call us or make callback request.
please call us or make callback request.
To learn more about Dukascopy Bank Binary Options
/ Forex trading platform, SWFX and other trading related information,
please call us or make callback request.
please call us or make callback request.
欲了解更多有关杜高斯贝银行差价合约/外汇交易平台,SWFX和其它相关交易详情,
请致电我们或要求回电。
请致电我们或要求回电。
To learn more about Crypto Trading / CFD / Forex trading platform, SWFX and other trading related information,
please call us or make callback request.
please call us or make callback request.
To learn more about Business Introducer and other trading related information,
please call us or make callback request.
please call us or make callback request.
For further information regarding potential cooperation,
please call us or make callback request.
please call us or make callback request.