Note: This section contains information in English only.
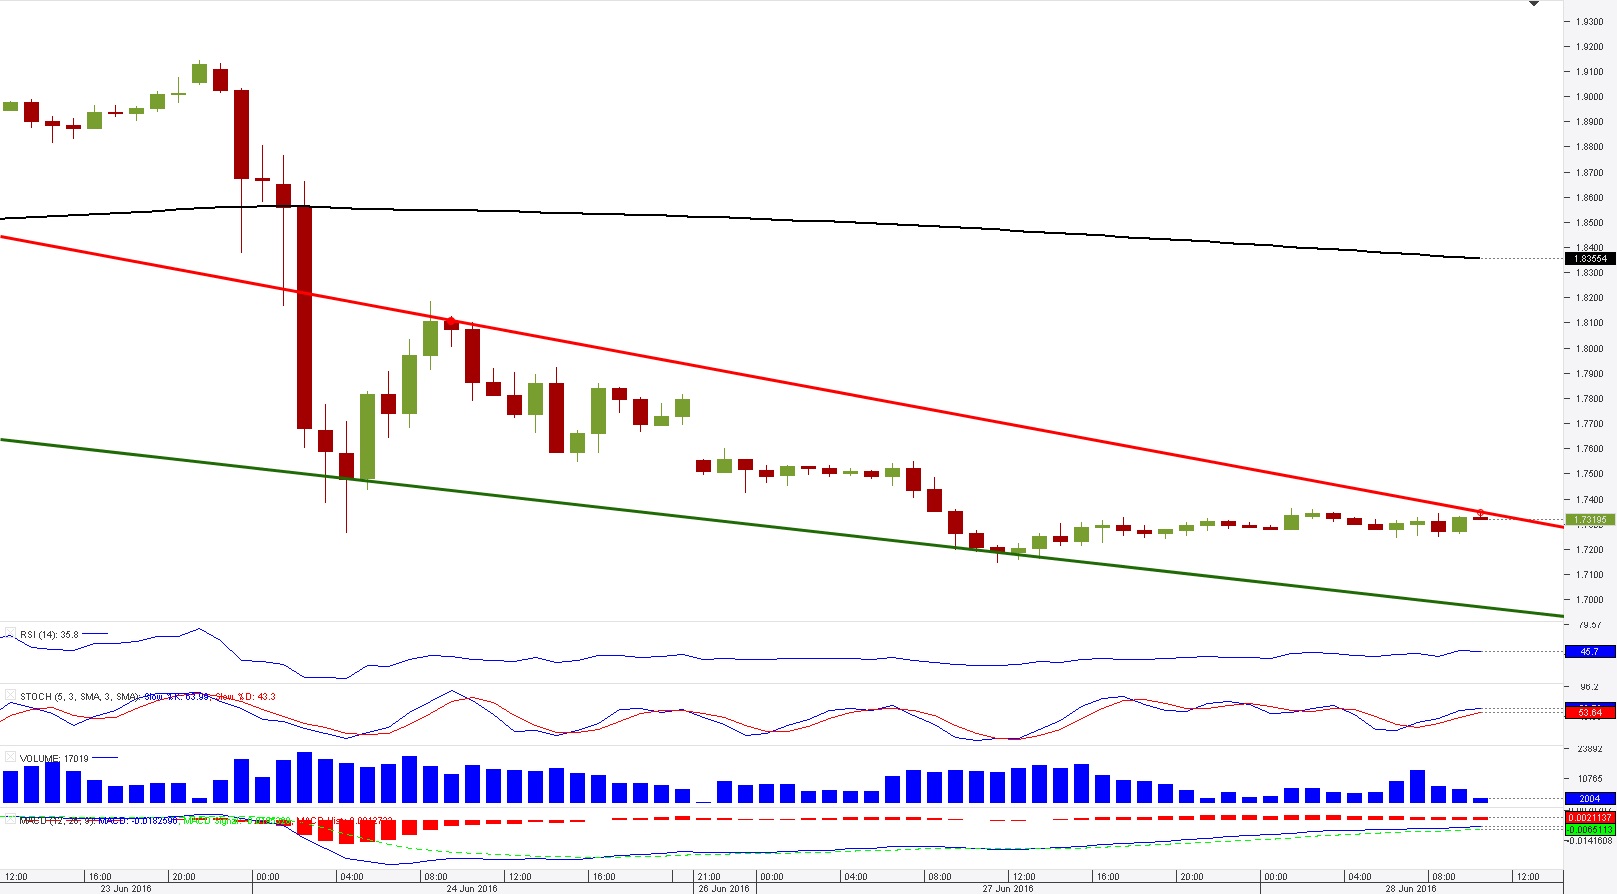
 With the announcement of the Brexit referendum results, the Pound fell sharply against all major currencies, including the Canadian Dollar. However, afterwards the currency pair has formed a falling wedge pattern, which has just been confirmed, as the currency exchange rate has just confirmed the patterns upper trend line at 1.7284. Although, the patterns upper trend line is not supported by any other resistance, the monthly S3 is located close by at 1.7410. In addition, the pattern is strengthened by the fact, that the pattern's lower trend line is supported by the weekly S1 at 1.6994. Moreover, the pair might be overbought, as 72% of all SWFX open positions are long.

Tue, 28 Jun 2016 12:29:06 GMT
Source: Dukascopy Bank SA
© Dukascopy Bank SA
© Dukascopy Bank SA
Actual Topics
Subscribe to "Fundamental Analysis" feed
订阅
欲了解更多有关杜高斯贝银行差价合约/外汇交易平台,SWFX和其它相关交易详情,
请致电我们或要求回电。
请致电我们或要求回电。
For further information regarding potential cooperation,
please call us or make callback request.
please call us or make callback request.
To learn more about Dukascopy Bank Binary Options
/ Forex trading platform, SWFX and other trading related information,
please call us or make callback request.
please call us or make callback request.
欲了解更多有关杜高斯贝银行差价合约/外汇交易平台,SWFX和其它相关交易详情,
请致电我们或要求回电。
请致电我们或要求回电。
To learn more about Crypto Trading / CFD / Forex trading platform, SWFX and other trading related information,
please call us or make callback request.
please call us or make callback request.
To learn more about Business Introducer and other trading related information,
please call us or make callback request.
please call us or make callback request.
For further information regarding potential cooperation,
please call us or make callback request.
please call us or make callback request.